

Karpenter picks the right instances and packs pods tighter, so the monthly cloud bill goes down. But the bill still arrives as a single line. How much of it the platform team burned, how much the data team burned, and how much a forgotten staging namespace has been quietly costing for three months — none of that is visible from the invoice. Cast AI’s “2026 State of Kubernetes Optimization” report puts average production CPU utilization at 8% — source — and even if autoscaling honestly doubles that number, it never answers “whose bill is this”: it optimizes the node, not a team’s budget. OpenCost is a CNCF project that sits next to a Prometheus you already run and turns the total bill into a chargeback by namespace, deployment, and label — for free.
Table of contents
Open Table of contents
- Node autoscaling is not the same thing as per-team allocation
- How Kubecost became OpenCost — and where it went after IBM
- The allocation model: how OpenCost prices a pod
- OpenCost vs Kubecost after the IBM acquisition
- What you need to run OpenCost next to Prometheus
- How to verify the numbers are real, not list price
- Bottom line
Node autoscaling is not the same thing as per-team allocation
Karpenter (or cluster-autoscaler) solves one specific problem: pick the cheapest, most tightly packed set of nodes for the cluster’s current load. It looks at pod requests and limits, adds or removes nodes, moves workloads to spot where it can — and does all of that well. But it has no concept of “team” or “product” at all: it sees pods as objects with resource requirements, not as line items in someone else’s P&L.
The catch is that a node is almost always shared. A single c5.2xlarge hosts a platform-team pod, a data-team pod, and a handful of kube-system pods. The node’s cost is known — it’s right there in the AWS bill. How to split that cost across three teams is a question Karpenter never answers, because it isn’t its job.
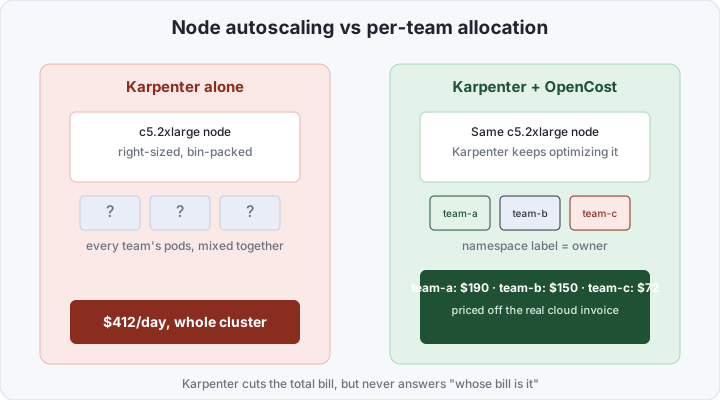
This is where OpenCost comes in: it doesn’t touch autoscaling and doesn’t second-guess Karpenter at the node level — it adds an allocation layer on top that takes the same node and splits its cost across labels, namespaces, and deployments, based on each pod’s actual CPU/memory consumption.
It’s not a cosmetic add-on. Without that layer, the only way to figure out who’s burning the budget is manually matching cloud resource tags to cluster namespaces — which works until the first shared cluster with a dozen teams, and falls apart immediately after. With per-namespace allocation, the same question turns into one query instead of half an hour in the billing console.
How Kubecost became OpenCost — and where it went after IBM
OpenCost started as the internal allocation engine inside the Kubecost startup. In June 2022 the core was carved out and donated to the CNCF as a standalone, vendor-neutral project — today it’s a CNCF Incubating Project, open source, with no lock-in to any single cloud. In September 2024, IBM acquired Kubecost the company, folding it into its FinOps lineup alongside Apptio Cloudability and Turbonomic — source. Kubecost as a commercial product is now squarely enterprise: multi-cluster aggregation, long-term history, SSO, right-sizing recommendations, and alerting — behind a subscription.
OpenCost, meanwhile, hasn’t gone anywhere or been orphaned: IBM has publicly confirmed continued investment in the project as a CNCF initiative, and Kubecost the product is still built on top of the open OpenCost engine — source. The distinction is now purely practical: OpenCost is the allocation engine plus its own UI/API, free and with no per-cluster limit; Kubecost is the same engine plus enterprise scaffolding sold separately.
The allocation model: how OpenCost prices a pod
OpenCost doesn’t invent its own telemetry — it reads the same metrics cAdvisor already feeds into Prometheus, and turns them into money.
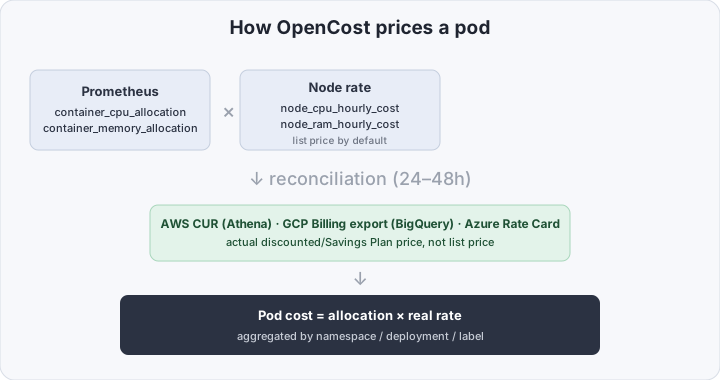
The calculation is two steps:
- Resource allocation. For every container, OpenCost takes
max(request, usage)for CPU and memory — billing on actual usage when it exceeds the request, and on the request when the pod sits idle below it. That guards against both distortions at once: a team with inflated requests doesn’t pay for capacity it never touches, and a team bursting past its requests doesn’t get billed a lower number than it actually consumed. - Node rate. By default the node’s cost comes from the cloud’s static price list (
node_cpu_hourly_cost,node_ram_hourly_cost), but OpenCost can connect to real billing data and reconcile those numbers against the actual invoice: AWS CUR through Athena, GCP Billing export through BigQuery, the Azure Rate Card API for EA/MCA contracts. Reconciliation accounts for Savings Plans, Reserved Instances, and spot discounts — giving you the price a team actually pays, not the public rate. The reconciliation lag is 24–48 hours, until the billing export lands on the other side.
Beyond CPU and memory, OpenCost also allocates network egress and persistent volumes — again by namespace/label, on the same “actual usage × real price” principle. That matters most for network traffic: cross-AZ traffic and egress out of the cloud is often a real line item, but by default the billing console only shows account-wide traffic, with no breakdown of which service generated it.
Allocation defaults to namespace, but real-world chargeback is almost always tied to an arbitrary label — say, team or cost-center, when teams share one namespace across several areas of ownership. OpenCost can group by those too: a pod just needs the right label, no need to move a workload into its own namespace for the sake of one line in a report.
OpenCost vs Kubecost after the IBM acquisition
| Dimension | OpenCost (CNCF, open source) | Kubecost (IBM/Apptio) |
|---|---|---|
| License | Apache 2.0, free | commercial subscription |
| Allocation engine | same one | same one (built on OpenCost) |
| Number of clusters | unlimited | billed per cluster |
| Data retention | limited by Prometheus retention | long-term storage in a separate store |
| Multi-cluster aggregation | build it yourself | out of the box |
| Right-sizing recommendations | no | yes |
| Budget alerting | not built in (build on Prometheus alerts) | built in |
| SSO / RBAC for the UI | no | yes |
| Vendor support | community, GitHub issues | IBM-backed SLA |
For a single cluster, or a team willing to build its own dashboards and alerts on top of the metrics, the difference is barely noticeable — it’s the same engine underneath. The gap shows up at scale: dozens of clusters, an SSO requirement for financial data, a need for vendor support with an SLA.
What you need to run OpenCost next to Prometheus
This assumes Prometheus is already in the cluster, scraping cAdvisor and kube-state-metrics — OpenCost doesn’t ship its own metrics collector, it reads the one you have.
helm repo add opencost https://opencost.github.io/opencost-helm-chart
helm repo update

helm install opencost opencost/opencost \
  --namespace opencost --create-namespace \
  --set opencost.prometheus.external.enabled=true \
  --set opencost.prometheus.external.url=http://prometheus-server.monitoring.svc:9090
Next, install the kubectl plugin so you don’t have to open a UI for every number:
kubectl krew install cost
kubectl cost namespace --window 7d
+---------+---------------+--------------------+-----------------+
| CLUSTER | NAMESPACE | MONTHLY RATE (ALL) | COST EFFICIENCY |
+---------+---------------+--------------------+-----------------+
| | team-data | 412.30 | 0.41 |
| | team-platform | 268.90 | 0.63 |
| | staging | 94.10 | 0.09 |
+---------+---------------+--------------------+-----------------+COST EFFICIENCY is the share of allocated resources actually used: staging at 0.09 is exactly the namespace paying for requests that almost never get claimed — the first candidate for a limits review.
For a deployment-level chargeback, one PromQL query straight into the Grafana you already have is more convenient than the plugin, using the metrics OpenCost exports itself on :9003/metrics:
topk(5,
  sum by (namespace, deployment) (
    container_cpu_allocation * on (node) group_left node_cpu_hourly_cost
    +
    container_memory_allocation_bytes / (1024*1024*1024)
      * on (node) group_left node_ram_hourly_cost
  )
)
Ready-made dashboards for the same set of metrics already exist on Grafana Labs — OpenCost / Overview for the cluster-wide picture and OpenCost / Workload for a per-deployment breakdown inside a namespace — importing by ID is enough, no separate ETL needed.
How to verify the numbers are real, not list price
Until cloud billing is connected, OpenCost honestly computes off the static price list — and that’s worth verifying explicitly rather than assuming “it’s running, so it must be right.”
kubectl get pods -n opencost -l app=cost-analyzer

curl -s http://localhost:9003/metrics | grep node_total_hourly_cost
# node_total_hourly_cost{instance="ip-10-0-4-12",...} 0.384
If, after configuring the AWS/GCP/Azure integration, node_total_hourly_cost for a given node noticeably shifts from what it was before, reconciliation is wired up and working. If the number hasn’t moved 48 hours after configuration, check access to the CUR bucket or the BigQuery dataset first: reconciliation usually fails silently because of permissions, not because the data isn’t there yet.
Bottom line
Node autoscaling and per-team cost allocation are two independent problems, and solving one doesn’t solve the other. Karpenter saves on infrastructure by packing nodes tighter and picking cheaper instances, but that saving is spread anonymously across the whole cluster. Understanding which team is actually burning it requires a separate allocation layer — and the good news is that layer doesn’t need to be bought: OpenCost does exactly that on top of metrics Prometheus is already collecting.