

Logs in prod answer one question — “was there anything at ERROR” — and stop there. They won’t tell you how many live users were hit, whether it’s the same error or a new one, which release introduced it, or what steps led up to it. Sentry takes an exception at the moment it happens and turns it into a reproducible event: stack, context, release, user. Let’s see how it works, how to avoid drowning in noise, and what you need to stand it up.
Table of contents
Open Table of contents
Why grep over logs isn’t error monitoring
The classic incident triage goes like this: a user says “it’s broken,” you open the logs, grep by time and traceback, and hope the line you need hasn’t aged out of retention. Three problems here.
Logs are flat. The same exception raised 4000 times is 4000 lines, and from them you can’t tell in a second whether it’s one bug hitting 300 users or 4000 separate problems. Logs are contextless: a line like NullPointerException at OrderService:42 carries neither the build version nor what the user did three clicks before the crash. And logs are reactive: you learn about a problem when someone complains, not when it started.
You need a tool that doesn’t write lines but collects error events: groups identical ones, drags the context along, and raises the alarm itself. Sentry is the de-facto open standard for that, with SDKs for nearly any language and a self-hosted option.
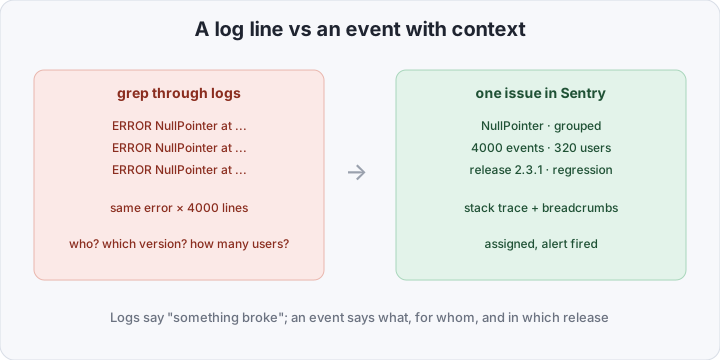
What Sentry does with an error
The core idea is not “store errors” but turn each one into a reproducible event. A few mechanisms do that:
- Grouping (fingerprint). Sentry computes a fingerprint from the stack and exception type and collapses identical ones into a single issue. Thousands of repeats become one card with a counter, not a wall of text.
- Breadcrumbs. The trail of actions before the crash: requests, clicks, SQL, logs. You see not just “where it broke” but “what led to it.”
- Releases. Every event is tied to a build version. You immediately see the bug arrived with release
2.3.1— it’s a regression, not “it was always like that.” - Source maps / debug symbols. Minified frontend or a compiled binary — Sentry unwinds it back to your source lines; the stack reads like it does in your IDE.
- Context. User, environment (prod/staging), tags (endpoint, OS, region). The error stops being abstract.
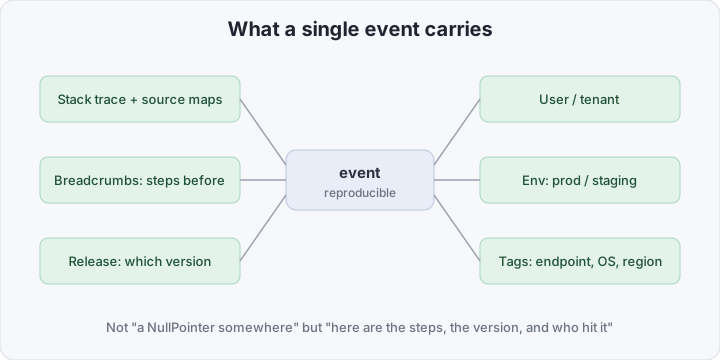
Together this changes triage itself: you open an issue and see a ready picture — here’s the version, the steps, who was hit — instead of reconstructing it from log fragments.
An event’s path: from exception to alert
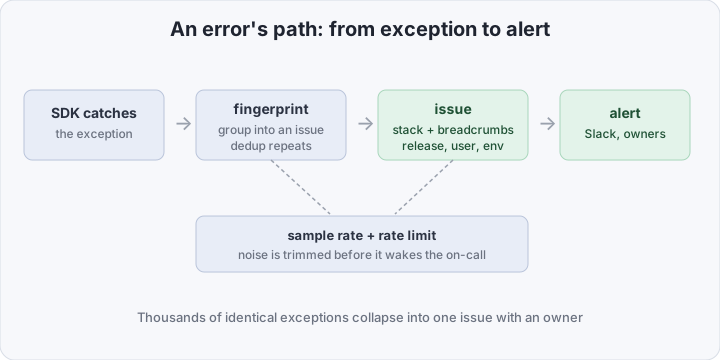
One pass looks like this: the SDK catches an unhandled exception → computes a fingerprint and groups it into an issue → attaches the stack, breadcrumbs and context → the issue is assigned to an owner and, if a rule matched, an alert flies to Slack or email.
The key node here is not waking the on-call for nothing. On a high-traffic service the same error can generate hundreds of events per second. sample_rate (send a fraction of events) and project-side rate limiting help: the issue is still created and its counter grows, but the alert channel doesn’t drown.
One comparison table
| Logs + grep | Sentry | |
|---|---|---|
| Duplicates | 4000 lines | one issue with a counter |
| Context | just the line | stack, breadcrumbs, user, tags |
| Version | hunt manually | release binding out of the box |
| Frontend stack | minified | unwound via source maps |
| How you learn | a user complains | alert at the spike |
| Noise | — | trimmed by sample rate + rate limit |
What you need to run Sentry
The minimum is the project DSN and SDK init at app startup. Example for Node.js; other ecosystems have an API that’s the same in spirit:
// instrument.js — load BEFORE the rest of your app code
import * as Sentry from "@sentry/node";

Sentry.init({
  dsn: process.env.SENTRY_DSN, // from project settings
  environment: process.env.NODE_ENV, // prod / staging — split by env
  release: process.env.GIT_SHA, // tie events to a build
  tracesSampleRate: 0.1, // 10% of transactions — performance
  sampleRate: 1.0, // fraction of errors (lower on noisy services)
});
Then three steps that turn “installed the SDK” into working monitoring:
-
Ship release and source maps from CI. On every deploy tell Sentry the version and upload source maps, or the frontend stack stays unreadable:
export SENTRY_RELEASE="$GIT_SHA" sentry-cli releases new "$SENTRY_RELEASE" sentry-cli sourcemaps upload --release "$SENTRY_RELEASE" ./dist sentry-cli releases finalize "$SENTRY_RELEASE" -
Set alerts like a human. Not “on every error,” but on a new issue and on a spike in frequency. Route by code ownership so the alert flies to whoever touched that file.
-
Quiet the noise up front. Filter known junk (bot connection resets, browser extensions) via
ignoreErrors/beforeSend, or within a week nobody will look at Sentry.
Self-hosted, if data must not leave your perimeter: the official getsentry/self-hosted comes up via docker compose — but it’s not “one box.” Inside are Postgres, ClickHouse (Snuba), Kafka and Redis; budget resources and backups. If the infra chores don’t pay off, cloud Sentry takes the operations off your plate.
How to verify it works
Don’t wait for a real incident — throw a test exception and confirm it lands with a stack:
// temporary route / script
Sentry.captureException(new Error("sentry smoke test"));
Within seconds the event should appear in the project — with the right environment, a bound release, and a readable stack. If the stack is minified, source maps didn’t arrive; if there’s no release, CI isn’t passing the version. Check the reverse too: an error you deliberately filtered in ignoreErrors should not show up.
Bottom line
Sentry closes the gap between “there’s an ERROR in the logs” and “we understand what broke.” The cost is an SDK at app startup, shipping release and source maps from CI, and the discipline to keep alerts and filters meaningful. The payoff: you learn of a regression at the spike, not from a support ticket, and you open an issue with ready context instead of doing log archaeology.
Paired with tracing and metrics (the same OpenTelemetry from the neighboring post), Sentry fills its niche in observability: metrics say “something degraded,” traces say “where the bottleneck is,” Sentry says “here’s the specific exception, the stack, and who it hit.” Three angles that together give the full picture of a prod incident.