

Wazuh is a free, open-source SIEM/XDR under the AGPL that covers a good share of what commercial products do: log collection, file integrity monitoring, vulnerability detection, active response. The price is your time to deploy and operate it. This is the first of six articles, and it covers installation only: from git clone to a working UI in one evening.
Table of contents
Open Table of contents
Why 4.x when 5.0 is coming
The current stable release at the time of writing is Wazuh 4.14.7. The project is already in a public 5.0 beta: clustering by default, Filebeat replaced, a rewritten analysis engine (see the release notes for the current status). Some of this will change. But before looking at what, we need a baseline workflow on stable 4.x: it is what you would put in production today, and what you will migrate from.
What Wazuh is made of
Three server components plus agents on the monitored hosts:
- wazuh-manager is the brain. It receives events from agents (ports 1514 and 1515), runs them through decoders and rules, and produces alerts. The API on port 55000 lives here too;
- wazuh-indexer is an OpenSearch fork. It stores alerts and events and handles search. It is the hungriest component for memory and disk;
- wazuh-dashboard is the web UI based on OpenSearch Dashboards, port 443. It stores nothing, it only displays.
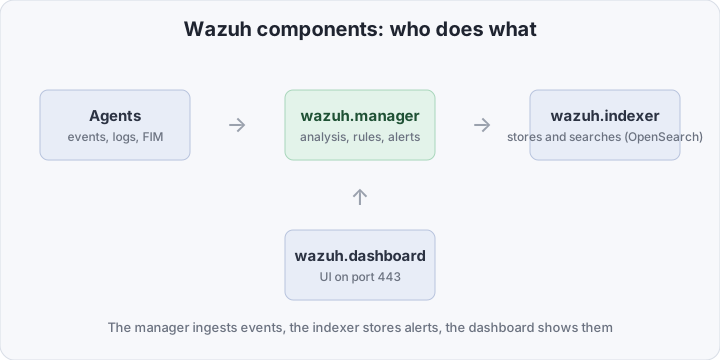
One important detail: detection rules and logic live in the manager, not the indexer. You can lose the indexer and rebuild it, losing history but not logic. The reverse is not true, and we will come back to that in the part on custom rules.
What you need for single-node
Requirements are more modest than you might expect, but not zero:
- Hardware: for a lab, 4 vCPU and 8 GB RAM, SSD. The indexer is a JVM process and will likely get OOM-killed on 4 GB. Current sizing per agent count is in Wazuh’s quickstart docs;
- Docker and Docker Compose v2;
vm.max_map_count=262144on the host: without it the indexer (OpenSearch) will not start;- free ports 443, 1514, 1515, 55000 and 9200.
The official repository with ready-made compose files is wazuh/wazuh-docker. Check out the tag for your version:
sudo sysctl -w vm.max_map_count=262144
echo 'vm.max_map_count=262144' | sudo tee /etc/sysctl.d/99-wazuh.conf

git clone https://github.com/wazuh/wazuh-docker.git -b v4.14.7
cd wazuh-docker/single-node
TLS certificates
The components talk to each other over TLS, so you need certificates before the first start. In the Docker flavor a one-shot container generates them, described in generate-indexer-certs.yml (the same logic as wazuh-certs-tool.sh in the classic host install):
docker compose -f generate-indexer-certs.yml run --rm generatorThe certificates land in config/wazuh_indexer_ssl_certs/. Treat that directory as a secret: the private keys are stored there.
Start
docker compose up -d
docker compose ps
single-node/docker-compose.yml defines three services: wazuh.manager, wazuh.indexer and wazuh.dashboard. The first start takes a few minutes: the indexer initializes its security configuration and the dashboard waits for it.
How to verify it works
# the indexer responds (default credentials, see below)
curl -sk -u admin:SecretPassword https://localhost:9200

# manager API: get a token
curl -sk -u wazuh-wui:'MyS3cr37P450r.*-' -X POST \
  "https://localhost:55000/security/user/authenticate?raw=true"
Open https://<host> in a browser (the certificate is self-signed, so expect a warning) and log in as admin / SecretPassword.
Change the passwords right away. The default credentials are publicly documented. That is fine for a local lab and unacceptable for anything reachable from a network. The procedure (a hash in
internal_users.ymlplus environment variables in compose) is in the Wazuh docs, and we will return to it in the hardening section.
What the dashboard shows out of the box
With no agents the dashboard is nearly empty, but not entirely:
- the manager’s built-in agent: the
wazuh.managercontainer registers itself as agent 000, so you already have at least one event source; - Server management: service status, rules and decoders (several thousand, readable and searchable), cluster settings, logs;
- Modules: Security events, Integrity monitoring, Vulnerability detection, MITRE ATT&CK, all without data until agents show up;
- Endpoints summary: an empty agent list and a Deploy new agent button that generates the install command for your OS.
A good first step is to click Deploy new agent, install the agent on any test Linux host, and watch events appear within a minute. Agents and FIM get full treatment in the next part.
Single-node is not production
This is the most important distinction, and worth stating before you show a “working SIEM” to management.
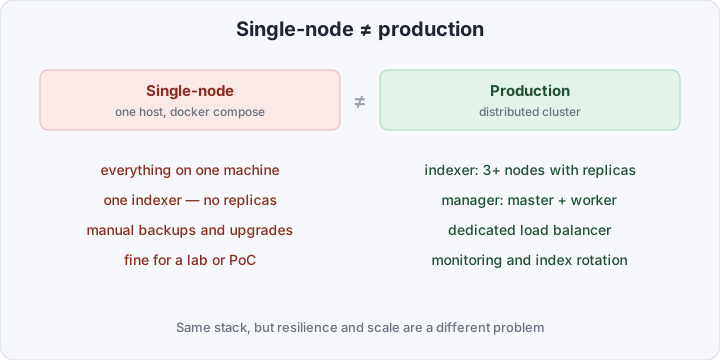
| Dimension | Single-node (docker compose) | Production |
|---|---|---|
| Indexer | 1 node, no shard replicas | 3+ nodes, replicas |
| Manager | 1 instance | master + worker cluster |
| Resilience | host down = event collection lost | survives a node failure |
| Scale | tens of agents | hundreds to thousands |
| Backups and upgrades | manual | scheduled, restore tested |
| Certificates and passwords | generated and default | rotation, own CA, secret manager |
| Purpose | lab, PoC, evaluating the stack | real monitoring |
Single-node is not a “small production”, it is a different class of solution. Same stack, but resilience, storage capacity, retention policy and operating model are a separate engineering task.
Bottom line
Standing up Wazuh in an evening does not give you a production-ready SIEM. But it is enough to start seeing events and decide whether you need this stack at all, before investing in a cluster, rules and integrations. Next in the series: agents and file integrity monitoring, custom rules and decoders, active response, Kubernetes audit logging, and pairing with Falco.