

The usual way to get a trace out of a service is: add an SDK, wrap the handlers, rebuild the image, and hope the instrumentation doesn’t break the thing it’s observing. OpenTelemetry eBPF Instrumentation (OBI) skips that whole path — it reads HTTP/gRPC/SQL traffic right in the kernel, through eBPF probes on syscalls and TLS libraries, and emits ready-made RED metrics and OTLP traces without a single line changed in the application. It isn’t a project built from scratch: Grafana Beyla’s work moved under the OpenTelemetry umbrella as OBI with contributions from Splunk, and it left beta at KubeCon + CloudNativeCon Europe 2026. Here’s what it adds on top of an OTel Collector you’ve already set up, and where its job ends.
Table of contents
Open Table of contents
Why this matters now
The CNCF Observability TAG reported that 67% of production clusters already run at least one eBPF observability tool — Cilium/Hubble for the network, Tetragon for security, Pyroscope for profiling. Tracing remained the last blind spot: getting a span with the latency of a specific HTTP request meant dragging an auto-instrumentation SDK into every service, separately, per language runtime. OBI closes exactly that gap, using the same class of mechanism as the rest of the eBPF stack in the cluster — just pointed at application L7 semantics instead of the network or syscalls.
Beyla started as a Grafana Labs experiment: prove that HTTP/gRPC tracing was possible without an SDK, by reading buffers right at the socket boundary and via uprobes on TLS libraries (to see traffic before encryption). Once it was clear the approach held up under real load, not just demos, the work was merged with parallel eBPF experiments from Splunk and handed to OpenTelemetry as its own official project — OBI. That matters: OBI isn’t a competitor to the OTel Collector, it’s just another telemetry source speaking the same OTLP.
Formally OBI is still beta, not GA: the configuration API can still shift between minor versions, and the list of supported language runtimes (Go, Java, Node.js, Python, .NET, Rust) covers the vast majority of production services, but not all — statically linked binaries on more exotic runtimes sometimes don’t get picked up automatically by the probes. For a typical HTTP/gRPC/SQL service on one of the listed languages that’s not a blocker, but check the support matrix for your version before rolling it out cluster-wide.
The problem: SDK auto-instrumentation is code, a build, and its own upkeep
SDK instrumentation solves tracing, but it charges for it three ways at once: code changes (or at minimum a wrapping shim), a separate build per runtime, and an agent that lives inside the application process and can affect it — from extra overhead to dependency-version conflicts. On a heterogeneous fleet (Go, Java, Python, Node in the same cluster) that means four different ways to get the same kind of trace, and four different places where instrumentation can drift from the application version or break on an upgrade.
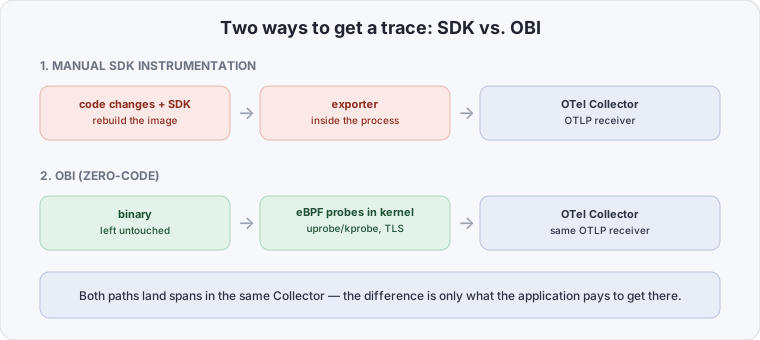
OBI removes two of those three costs — code changes and a separate build — because it attaches to the kernel, not the application process. eBPF probes go on syscalls (accept, read, write) and on TLS library functions (OpenSSL, BoringSSL, Go’s crypto/tls), so OBI sees both plaintext and encrypted HTTP/gRPC traffic, matches requests to responses, and generates a span with latency, status code and path — without touching a single byte of the application binary. It ships as one DaemonSet per cluster, not N agents for N services.
What OBI adds on top of an OTel Collector you already run
If the cluster already has a minimal OpenTelemetry Collector running, OBI plugs in as another source — it exports the same OTLP spans and metrics, no collector config changes needed. Specifically, OBI adds:
- RED metrics out of the box — request rate, error rate, duration per HTTP/gRPC endpoint, with zero metrics instrumentation in the application.
- Distributed tracing across services — OBI propagates and reads
traceparent, so spans from zero-code services join the same trace as spans from manually instrumented services. - Coverage for legacy and third-party binaries — services whose code is expensive or impossible to change (vendored images, old monoliths) get tracing on par with new code.
- A single update point — instrumentation version lives on the DaemonSet, not scattered across N application images; updating OBI is a
kubectl rollout, not N pull requests.
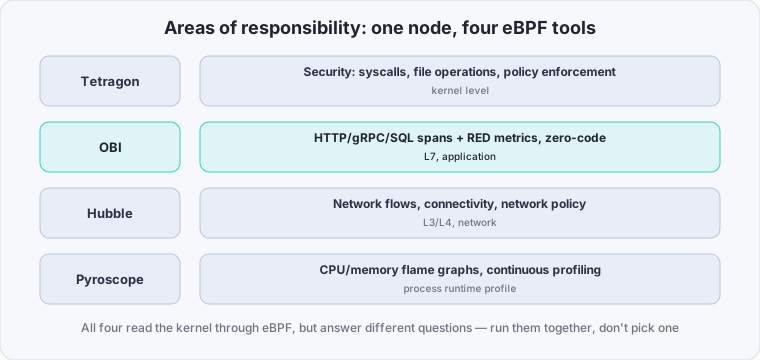
It’s important not to conflate OBI with the other eBPF observability tools that often already sit in the same cluster. Hubble (part of Cilium) looks at L3/L4 — who’s talking to whom, which network policies fired — but doesn’t see HTTP paths or SQL queries inside a connection. Tetragon solves a security problem: it detects and blocks risky syscalls and file operations at runtime, not latency. Pyroscope profiles — it shows where the application spends CPU and memory at the call-stack level, not what it actually answered the client. All four read the kernel through the same eBPF mechanism, but they answer different questions, and it’s worth running them together rather than picking one over the others.
| Tool | What it sees | Layer | Zero-code |
|---|---|---|---|
| OBI | HTTP/gRPC/SQL spans, RED metrics | L7, application | Yes |
| Hubble | Network flows, policy, connectivity | L3/L4, network | Yes |
| Tetragon | Syscalls, file operations, security events | Kernel, security | Yes |
| Pyroscope | CPU/memory flame graphs | Process runtime profile | Partial (needs an agent) |
| Manual SDK | Custom business spans, arbitrary semantics | L7, business logic | No |
What it takes to get your first trace without a line of code
OBI runs as a DaemonSet with privileged: true (it needs CAP_BPF and access to /sys/kernel/debug) and a minimal config that just points it at the OTLP endpoint — the same collector already receiving traces from the rest of the fleet:
apiVersion: apps/v1
kind: DaemonSet
metadata:
  name: obi
  namespace: observability
spec:
  selector:
    matchLabels:
      app: obi
  template:
    metadata:
      labels:
        app: obi
    spec:
      hostPID: true
      containers:
        - name: obi
          image: otel/obi:latest
          securityContext:
            privileged: true
          env:
            - name: OTEL_EXPORTER_OTLP_ENDPOINT
              value: "http://otel-collector.observability:4317"
            - name: OTEL_EBPF_KUBE_METADATA_ENABLE
              value: "true"
            - name: OTEL_EBPF_TRACE_PRINTER
              value: "text"
          volumeMounts:
            - name: sys-kernel-debug
              mountPath: /sys/kernel/debug
      volumes:
        - name: sys-kernel-debug
          hostPath:
            path: /sys/kernel/debug
OTEL_EBPF_KUBE_METADATA_ENABLE pulls namespace, pod and service labels from the Kubernetes API so spans are tagged the same way as spans from manually instrumented services — without it you’d be matching them up by IP by hand. Nothing else needs configuring: OBI discovers processes listening on TCP ports in the same network namespaces on its own, attaches probes to them, and starts shipping spans to the collector.
By default OBI tries to discover and instrument every process on the node, which on a dense cluster means paying overhead for services nobody wants traced (sidecars, init containers). Narrow it down with OTEL_EBPF_DISCOVERY_SERVICES — a namespace/label selector that limits the set of instrumented processes to the same services already writing metrics to Prometheus. The overhead difference is real: eBPF probes are cheaper than in-process SDK instrumentation, but not free, and profiling a namespace like kube-system usually isn’t worth it.
How to verify it’s working
The easiest way to confirm OBI is actually generating spans is to check the logs with the text trace printer, then compare against manual instrumentation on the same service:
kubectl logs -n observability -l app=obi --tail=50 | grep "HTTP"Lines like GET /api/orders 200 12ms in the output mean the probes fired and spans made it to the collector. From there, open the same service in Grafana/Tempo and cross-check: if the service already had SDK instrumentation, OBI’s traces should show up alongside the SDK’s traces with matching HTTP-level latency — confirming both sources are observing the same reality, just at a different depth of detail.
Where zero-code ends
OBI sees the network boundary — a process’s inbound and outbound edges, the HTTP path, the SQL query, the status code. It doesn’t see what happens inside the business logic between those boundaries: custom span attributes (a user ID, a plan tier, an order number), explicit child spans wrapping a specific function, business-event counters that don’t map to a network call. The moment you need semantics that can’t be derived from the request/response itself, that’s a job for manual SDK instrumentation on top of the same OTel pipeline, not for OBI.
OBI covers 80% of typical HTTP/SQL tracing for free, with no SDK deployed into every service — a fair trade for a heterogeneous fleet, legacy code, and services that are expensive to touch. The remaining 20% of business semantics still needs manual spans, and OBI never claims otherwise: it closes the network layer of observability, it doesn’t replace product instrumentation.