

Six months ago we stood up Backstage in a single evening and got a service catalog. Six months later, engineers keep asking: “why are we even looking at this?” A catalog without a scorecard turns into a list of links people open once during onboarding and never again — the moment a platform team starts looking like an infrastructure service running on trust rather than something measurable.
Table of contents
Open Table of contents
- A catalog is a showcase, a scorecard is a lever
- What actually counts as a metric
- TechInsights: the open-source alternative to Port and Cortex
- What this looks like for a team, not just for the platform
- Platform NPS: measuring satisfaction with the platform itself
- Comparison: catalog alone vs. catalog with scorecards
- Anti-pattern: scorecard as a stick to beat teams with
- How to verify it works
- Bottom line
A catalog is a showcase, a scorecard is a lever
Backstage, Port, and Cortex are all equally good at listing services, their owners, and repo links. That’s useful, but it creates zero incentive to improve anything. A catalog answers “what do we have”; leadership and the teams care far more about “which of this is fine, and which isn’t — on which dimension.”
A scorecard closes that gap: quantitative checks run against every service in the catalog, turned into a clear number or status — “7 out of 10,” “green/yellow/red,” “covered / not covered.” A catalog is a database; a scorecard is a function over it that outputs a signal to act on.
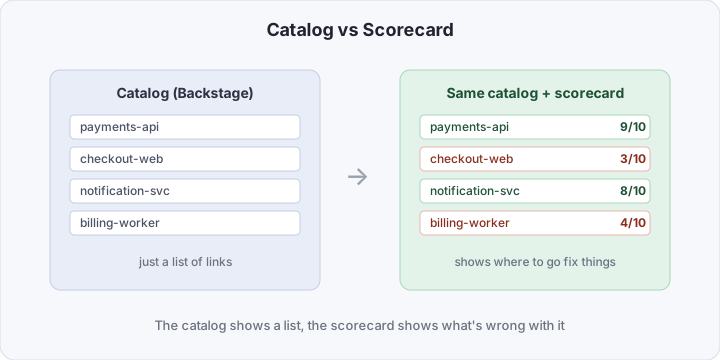
Gartner projects that by the end of 2026, 80% of large engineering organizations will have a dedicated platform team — meaning more teams that will need to justify to leadership why a service catalog is worth funding, not just another UI. Without a scorecard, that pitch falls flat: “we have a nice-looking list” isn’t an argument in a budget conversation.
What actually counts as a metric
Not every number makes a useful metric. A good scorecard metric has an unambiguous data source, updates automatically, and points to a concrete action rather than just describing a state. A sensible starting set:
- On-call load. Number of alerts per service over the last 30 days, and the share resolved without escalation. Rising load on one service is a signal to invest in it, not just endure it.
- SBOM freshness. When the Software Bill of Materials was last generated and whether it’s stale relative to the latest release. A stale SBOM means that at the next Log4Shell, nobody can quickly say whether a service is affected.
- Test coverage. Not the absolute number (100% coverage isn’t a goal in itself), but the trend — falling or rising relative to last quarter.
- Documentation staleness. Date of the last README/TechDocs change relative to the last deploy date. If a service deployed ten times and the docs never changed, they’re almost certainly lying.
- Build provenance presence. A binary flag: is the service’s artifact signed with SLSA provenance — did it go through trusted CI, rather than get built locally by someone and pushed straight to the registry.
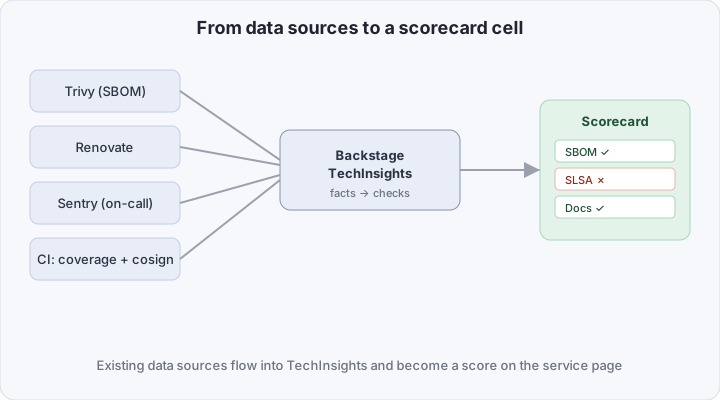
The key property of this set: all five metrics are already collected by tools you run. On-call comes from PagerDuty/Sentry, SBOM and provenance from Trivy and signed CI artifacts, test coverage from the pipeline’s own report, doc staleness from git history. A scorecard doesn’t create new data — it aggregates what already exists into one place.
TechInsights: the open-source alternative to Port and Cortex
Port and Cortex sell scorecards as a ready-made feature of a commercial IDP: hook up sources through their connectors, get a dashboard. For a team that already runs Backstage, paying for a separate product for one feature is overkill — Backstage has its own TechInsights plugin that does the same thing on top of a catalog you’ve already configured.
TechInsights works through two entities: facts — raw data collected on a schedule by a FactRetriever — and checks — conditions over those facts that produce true/false or a numeric score. A scorecard is simply a named group of checks attached to a catalog entity.
# app-config.production.yaml
techInsights:
  factRetrievers:
    slsaProvenanceFactRetriever:
      cadence: "PT1H"
      schedule:
        frequency: { hours: 1 }
        timeout: { minutes: 5 }

  scorecards:
    - id: supply-chain
      title: "Supply chain hygiene"
      description: "Does the service have signed build provenance"
      checks:
        - id: has-slsa-provenance
          type: boolean
          factRef:
            - fact: hasSlsaProvenance
              schema: slsaProvenanceFactRetriever
          rule:
            operator: equals
            value: true
The FactRetriever for hasSlsaProvenance is a TypeScript module that, on each run, hits the registry, looks for an attestation next to the image (the same cosign verify-attestation your pipeline already uses), and writes true/false into the TechInsights database for every service in the catalog. The has-slsa-provenance check then just reads that fact and colors the scorecard cell green or red.
What this looks like for a team, not just for the platform
A dedicated scorecard dashboard is useful to leadership, but for an engineer opening their service’s page in Backstage, the value is elsewhere — the EntityScorecardContent widget embedded right in the same tab where they already look at CI status and dashboard links. They don’t go somewhere separate to check a service’s “health” — it’s already sitting next to the information they were opening anyway.
This cuts the other way too: if a scorecard only lives on a separate page for managers, engineers simply won’t see it and won’t react to red cells. Embedding it in the page the team already works from isn’t cosmetic — it’s the condition under which the metric affects behavior at all.
Platform NPS: measuring satisfaction with the platform itself
Technical scorecards answer “is the service healthy.” A separate, equally important question is “do engineers think the catalog and golden paths actually help them.” This is measured with the classic Net Promoter Score, adapted for platform engineering: a one-question survey each quarter — “how likely are you to recommend the internal platform to a colleague, 0 to 10” — plus an optional free-text field.
Industry benchmarks: a platform NPS below 0 means the platform is more of a hindrance than a help, and that’s worth investigating before adding any new catalog features. NPS in the 0–30 range is typical for a platform that’s already delivering value but isn’t something the team is proud of. Above 30 is rare even for mature platform organizations, and it’s worth chasing not for the number itself but because it usually correlates with genuinely low onboarding time and few tickets to the platform team.
One important detail: NPS needs to be collected anonymously, not tied to specific team respondents. The moment the survey becomes attributable, answers start reflecting fear of upsetting the platform’s owners rather than an actual opinion of the platform.
Comparison: catalog alone vs. catalog with scorecards
| Catalog without a scorecard | Catalog with a scorecard | |
|---|---|---|
| What an engineer sees | A list of services and links | The list plus a score on every dimension |
| How you learn a service needs fixing | By accident, via an incident | A red cell appears before the incident |
| The pitch for platform team budget | ”We have a nice UI" | "X services went from 40% to 90% SLSA coverage this quarter” |
| Source of truth for quality | The tech lead’s opinion | Aggregated data from Trivy/Renovate/Sentry/CI |
| Satisfaction with the platform | Not measured | Platform NPS, quarterly |
Anti-pattern: scorecard as a stick to beat teams with
The fastest way to kill the value of scorecards is to turn them into a KPI teams get graded on at performance review. The moment a red cell threatens someone’s bonus, the exact thing that happens to any metric turned into a target happens here too: teams start optimizing the metric instead of what it was supposed to measure. Test coverage gets padded with assertion-free tests, docs get a one-line edit each quarter just to bump the last-modified date, SLSA provenance gets added formally without anyone checking the signature is actually valid.
The correct use of a scorecard is prioritizing platform work, not punishing product teams. A red “no SLSA provenance” cell on fifteen out of twenty services isn’t fifteen teams at fault — it’s a signal to the platform team that provenance needs to become part of the golden path by default, not documentation people are supposed to read and apply by hand. A scorecard’s job is not to assign blame, but to point at where the next platform sprint should go.
How to verify it works
Once the FactRetriever and scorecard are defined in app-config.production.yaml and Backstage has restarted, there are three quick checks. First, the fact is actually being collected: curl -s localhost:7007/api/tech-insights/facts/slsaProvenanceFactRetriever/latest | jq should return a non-empty array with hasSlsaProvenance fields for services in the catalog, not a 404. Second, the check evaluates: curl -s localhost:7007/api/tech-insights/checks/has-slsa-provenance/result?entity=component:default/my-service | jq .result should return true or false, not null. Third, the widget is actually visible: open any service’s page in the UI and confirm EntityScorecardContent renders a colored cell rather than an empty block with an error in the browser console.
Bottom line
A service catalog without a scorecard is a list of links people check once during onboarding. A scorecard turns that same catalog into a measurable asset: concrete numbers on security, reliability, and documentation, pulled from the Trivy, Renovate, and Sentry you already run through the open-source TechInsights plugin — no need to pay for a commercial Port or Cortex for one feature. The cost is a few evenings writing FactRetrievers and the discipline not to turn green cells into a performance-review KPI. The payoff is a platform team that can tell leadership not “we have a catalog” but “here’s how much supply chain hygiene grew this quarter.”