

Canary deploys with automatic rollback were long the privilege of clusters running a service mesh: splitting live traffic by percentage was something Istio VirtualService or Linkerd’s SMI splits could do, and everyone else made do with ingress-controller annotations. Argo Rollouts removed that constraint: the official trafficrouter-gatewayapi plugin splits traffic directly in a standard HTTPRoute, and an AnalysisTemplate reading Prometheus metrics decides on its own whether to promote the release or roll it back. No service mesh required — just Gateway API, which by 2026 almost everyone already has.
Why now: starting with Rollouts 1.9 the plugin supports maxTrafficWeight — you can stretch the weight scale to a million and split traffic finer than 1%, and the ecosystem (Cilium, kgateway, VPC Lattice) is building integrations on top of Gateway API. Progressive delivery has moved from mesh-specific resources to the cluster’s standard API, and the barrier to entry has collapsed.
Table of contents
Open Table of contents
Rollout instead of Deployment: what changes
A Deployment with RollingUpdate replaces pods on a schedule and never asks the metrics — a problem we covered in detail in our Flagger article. Argo Rollouts solves it at the manifest level: instead of a Deployment you describe a Rollout — same pod template, but a canary strategy with explicit steps. It plays well with Argo CD out of the box: for a GitOps pipeline it’s just another CRD in git.
In canary mode the Rollout keeps two ReplicaSets — stable and canary — and two Services with the same selector: web-stable and web-canary. No, they won’t grab the same pods: the Rollout stamps each ReplicaSet’s pods with a rollouts-pod-template-hash label, so the stable Service selects the old pods and the canary Service the new ones. And the traffic between them is split not by kube-proxy but by the Gateway — according to the weights in an HTTPRoute with two backendRefs:
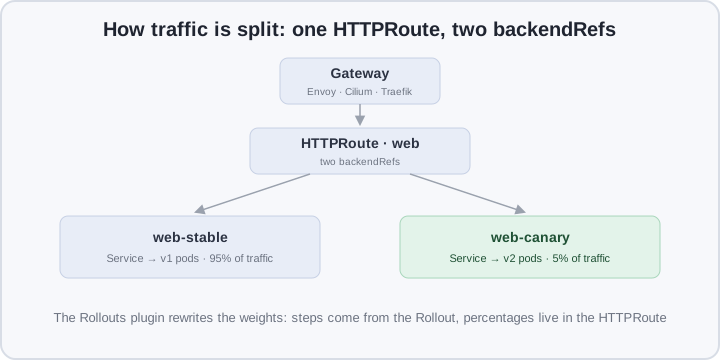
The key mechanism: the argoproj-labs/gatewayAPI plugin inside the controller rewrites the weight field of both backendRefs whenever the Rollout advances a step. The Gateway — Envoy Gateway, Cilium, Traefik, kgateway, anything implementing Gateway API v1 — executes the percentages faithfully. Git holds the manifest without weights; the live state is changed by the controller: steps are declarative, execution is automatic.
AnalysisTemplate: the metrics that kill a release
Shifting traffic is half a canary. The other half is the “promote or not” decision, and Argo Rollouts takes that away from humans too. An AnalysisTemplate is a CR describing a metric: which query to run against Prometheus, how often, what value counts as a failure, and how many failures we tolerate.
When the Rollout reaches an analysis step, it creates an AnalysisRun object that blocks further progress: every interval it runs the query and checks the result against the condition. Once failed measurements exceed failureLimit, the AnalysisRun is marked Failed and the Rollout aborts: the plugin instantly returns 100% of the weight to the stable backendRef, canary pods scale to zero, and the Rollout status becomes Degraded. No kubectl rollout undo at 3 a.m. — the controller rolls back in seconds.
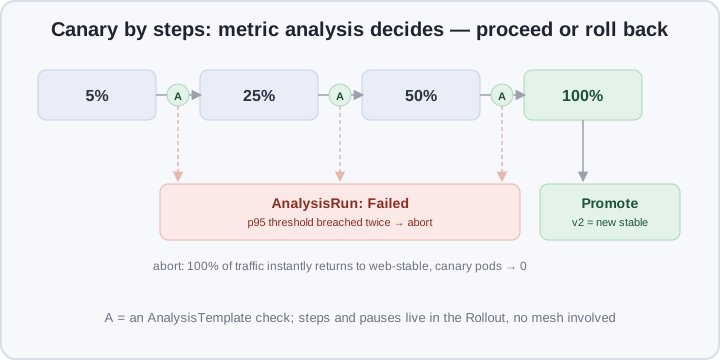
The metrics don’t have to be infrastructure ones: the query is arbitrary PromQL, so the threshold can be payment success rate or conversion, not just p95 and error-rate.
Comparison in one table
Deployment + RollingUpdate | Rollout + Gateway API | |
|---|---|---|
| Traffic shift | as pods become ready | in steps of 5 → 25 → 50 → 100% via HTTPRoute |
| Metric analysis | none, alerts after the fact | an AnalysisRun at every step |
| Rollback decision | a human, paged | the controller, on a threshold from git |
| Minimal blast radius | ~25% of traffic (maxUnavailable) | 5% or finer |
| Service mesh | not needed, but no splits either | not needed — splits a standard HTTPRoute |
| GitOps | image in git, then blind | same manifests + native Argo CD fit |
| Rollback | minutes and a human | seconds and a controller |
What you need to run a canary
Preconditions: a cluster with a v1 Gateway API implementation (Envoy Gateway, Cilium, Traefik, kgateway) and Prometheus carrying your app’s metrics. Then four steps.
1. Controller, CLI and the plugin. Install Argo Rollouts and the kubectl plugin:
kubectl create namespace argo-rollouts
kubectl apply -n argo-rollouts \
  -f https://github.com/argoproj/argo-rollouts/releases/latest/download/install.yaml
kubectl krew install rollouts
The plugin is wired in through a ConfigMap with the fixed name argo-rollouts-config:
apiVersion: v1
kind: ConfigMap
metadata:
  name: argo-rollouts-config   # the name is fixed
  namespace: argo-rollouts
data:
  trafficRouterPlugins: |-
    - name: "argoproj-labs/gatewayAPI"
      location: "https://github.com/argoproj-labs/rollouts-plugin-trafficrouter-gatewayapi/releases/download/v0.5.0/gatewayapi-plugin-linux-amd64"
Apply it, restart the controller (kubectl -n argo-rollouts rollout restart deployment argo-rollouts) and check the logs for the line Downloading plugin argoproj-labs/gatewayAPI. For offline clusters there’s an init-container variant using an image from ghcr.io — see the plugin docs.
2. RBAC. The plugin needs to read Services and patch HTTPRoutes (and GRPCRoutes if you use them):
apiVersion: rbac.authorization.k8s.io/v1
kind: ClusterRole
metadata:
  name: argo-rollouts-gatewayapi
rules:
  - apiGroups: [""]
    resources: [services]
    verbs: [get]
  - apiGroups: [gateway.networking.k8s.io]
    resources: [httproutes, grpcroutes]
    verbs: [get, list, patch, update]
Bind the role to the argo-rollouts ServiceAccount with a ClusterRoleBinding — and the cluster is ready.
3. Two Services and an HTTPRoute. The selectors are identical — the Rollout will sort it out:
apiVersion: v1
kind: Service
metadata:
  name: web-stable
  namespace: prod
spec:
  selector: { app: web }
  ports: [{ port: 80, targetPort: http }]
---
apiVersion: v1
kind: Service
metadata:
  name: web-canary
  namespace: prod
spec:
  selector: { app: web }
  ports: [{ port: 80, targetPort: http }]
---
apiVersion: gateway.networking.k8s.io/v1
kind: HTTPRoute
metadata:
  name: web
  namespace: prod
spec:
  parentRefs: [{ name: eg }]
  rules:
    - matches: [{ path: { type: PathPrefix, value: / } }]
      backendRefs:
        - { name: web-stable, kind: Service, port: 80 }
        - { name: web-canary, kind: Service, port: 80 }
No weights in the manifest — the plugin writes those on the very first rollout.
4. AnalysisTemplate and the Rollout itself. A p95 analysis template with failureLimit: 2:
apiVersion: argoproj.io/v1alpha1
kind: AnalysisTemplate
metadata:
  name: p95-latency
  namespace: prod
spec:
  args:
    - name: service
  metrics:
    - name: p95
      interval: 1m
      count: 3
      failureLimit: 2
      failureCondition: result[0] >= 500
      provider:
        prometheus:
          address: http://prometheus.monitoring:9090
          query: |
            histogram_quantile(0.95,
              sum by (le) (rate(http_request_duration_seconds_bucket
                {service="{{args.service}}", version="canary"}[2m]))
            ) * 1000
Three measurements a minute apart; two worse than 500 ms — and the AnalysisRun goes Failed. Now the Rollout with 5/25/50/100 steps:
apiVersion: argoproj.io/v1alpha1
kind: Rollout
metadata:
  name: web
  namespace: prod
spec:
  replicas: 10
  selector: { matchLabels: { app: web } }
  template:
    metadata: { labels: { app: web } }
    spec:
      containers:
        - name: web
          image: registry.example.com/web:v1
          ports: [{ name: http, containerPort: 8080 }]
  strategy:
    canary:
      stableService: web-stable
      canaryService: web-canary
      maxSurge: 1
      maxUnavailable: 0
      trafficRouting:
        plugins:
          argoproj-labs/gatewayAPI:
            httpRoute: web
            namespace: prod
      steps:
        - setWeight: 5
        - pause: { duration: 2m }
        - analysis:
            templates: [{ templateName: p95-latency }]
            args: [{ name: service, value: web }]
        - setWeight: 25
        - pause: { duration: 5m }
        - analysis:
            templates: [{ templateName: p95-latency }]
            args: [{ name: service, value: web }]
        - setWeight: 50
        - pause: { duration: 5m }
        - analysis:
            templates: [{ templateName: p95-latency }]
            args: [{ name: service, value: web }]
        - setWeight: 100
Each step: raise the weight, let the metrics accumulate, ask Prometheus. Want a manual gate — insert pause: {} with no duration: the Rollout freezes until kubectl argo rollouts promote. And if you need sub-percent precision, add maxTrafficWeight: 10000 under trafficRouting (Rollouts 1.9+): a setWeight: 100 step then means 1% of traffic.
How to verify the auto-rollback
A run against a deliberately broken release is the only honest test. Deploy a version that sinks the p95:
kubectl argo rollouts set image web web=registry.example.com/web:v2-broken
kubectl argo rollouts get rollout web -n prod --watch
The expected picture: the weight climbs to 5%, pause, the AnalysisRun takes its measurements; on the third one (two failures at failureLimit: 2) the status flips to Failed, the Rollout to Degraded, and the weight arrow returns to zero. Check the actual route state:
kubectl -n prod get httproute web -o jsonpath='{.spec.rules[0].backendRefs}'After the rollback it reads 100/0 — all traffic back on web-stable. The events (via kubectl -n prod describe rollout web) will show which metric exceeded the threshold and by how much. Standing advice: rerun this negative drill after every change to the thresholds — an AnalysisTemplate that has never killed a release is an AnalysisTemplate you haven’t tested.
Rollouts or Flagger
We wrote about Flagger before — it’s the closest and fully comparable alternative, also mesh-free, also on Gateway API. The honest difference. Flagger wraps your existing Deployment without changing its kind — zero migration; it ships built-in webhook load tests and belongs to the Flux ecosystem. Rollouts replaces the Deployment with its own CR — the migration touches manifests, but steps with pauses and manual gates are explicit, the AnalysisRun is a separate reusable object, and you get blue-green, Experiment and a kubectl plugin with a live UI. Rule of thumb: Flux shop with a “don’t touch the Deployment” stance — take Flagger; Argo CD shop that needs pauses with manual promotion — Rollouts. Both deliver the same core thing: a rollback in seconds on metrics instead of a rollback in minutes on a pager.
Pitfalls
- The plugin didn’t download. The controller restarted before the ConfigMap applied, or the cluster can’t reach GitHub — check the logs: the line
Downloading plugin argoproj-labs/gatewayAPIis mandatory. Offline — the init-container variant fromghcr.io. - An old Gateway API implementation. Plugin 0.3+ works with
gateway.networking.k8s.io/v1resources; implementations stuck on v1beta1 are only supported by plugin release 0.2.0. Check the provider-status page before picking a gateway. - Empty Prometheus response. If the canary gets no traffic, the query returns an empty array — that’s an Error, not a Failed measurement; errors accumulate separately and four in a row also fail the run. On low-percentage steps, filter the metric by version, not by pod.
- Argo CD fights over the weights. While a canary runs, the plugin labels the HTTPRoute with
rollouts.argoproj.io/gatewayapi-canary=in-progress; configureignoreDifferencesfor HTTPRoute in Argo CD (a jq expression keyed on that label), or every sync will revert the weights to the git state.
Bottom line
A service mesh is no longer a prerequisite for canaries: any cluster with Gateway API gets the full progressive delivery loop — steps, pauses, metrics, auto-rollback — for the price of one controller and a plugin. The cost: swapping Deployment for Rollout, RBAC for the plugin, and a careful ignoreDifferences for Argo CD. The payoff: a broken release is seen by 5% of users instead of all of them, and the rollback happens on a git-declared threshold in seconds — no on-call human with a pager. If you already run Gateway API, you can try this in one evening.