

The budget for AI assistants is approved, the pilot is running — and a quarter later, deployments break more often than before it. DORA’s 2026 research explains why that isn’t “bad AI” but arithmetic: AI is an amplifier, not a medicine. It multiplies the volume of changes your team produces — and if your delivery system was choking before, now it chokes faster.
Why now: the State of AI-assisted Software Development report names the amplification effect as its headline finding on AI — returns are moderated by platform quality, and platform engineering moved from “nice to have” to “prerequisite” (dora.dev). Below is what that means for a five-person team, with no enterprise gravitas, and how to compute your own baseline in one evening, before buying any subscriptions.
Table of contents
Open Table of contents
- The four keys — the language DORA speaks about platforms
- The main finding: the platform is the moderating factor
- Why an unstable pipeline gets worse with AI
- What to reinforce before subscribing to AI
- Mini-DORA in one evening: the four keys from GitHub Actions logs
- How to verify the numbers aren’t lying
- Bottom line
The four keys — the language DORA speaks about platforms
DORA (DevOps Research and Assessment) is a research program that since the early 2010s has mapped software delivery practices to business outcomes. Its vocabulary is four metrics, the four keys:
- Lead time for changes — from commit to the change running in production.
- Deployment frequency — how often changes actually reach users.
- Change failure rate — the share of deployments that need a rollback, patch, or incident.
- MTTR — time to recover from a failed deployment (the 2026 reports call it failed deployment recovery time, but everyone still says MTTR).
The first two measure throughput — how much the system passes; the other two measure stability — how much breaks along the way. Common sense says these are scales on a balance: go faster, lose reliability. DORA’s data has said the opposite for years: top-tier teams win on both scales at once — not because they “work faster,” but because their platform makes small, frequent changes cheap and safe. The four keys are a thermometer for the platform: they don’t say “good or bad,” they show where exactly the bottleneck is.
The main finding: the platform is the moderating factor
DORA measured how AI adoption changes the four keys and got a picture that looks contradictory at first: the same class of tools accelerated delivery for some teams and increased lead time and change failure rate for others.
One thesis resolves the contradiction: the payoff from AI is moderated by platform quality. AI sharply raises the volume of produced changes — code, PRs, migrations, configs. The only question is whether your delivery system can digest them. A mature platform passes the increased flow — and the gain materializes. A weak one drowns — and the same flow turns into queues, false reds, and rollbacks.
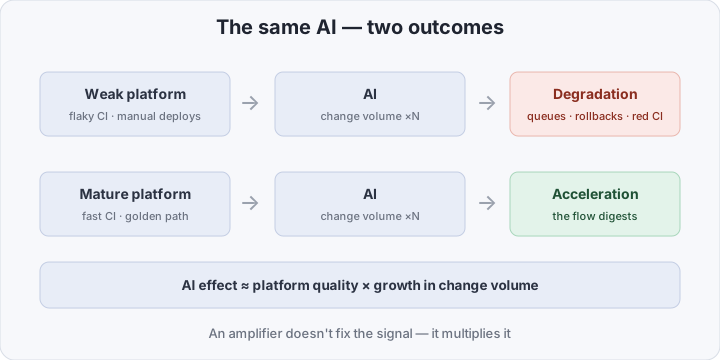
Hence the practical formula: AI’s effect ≈ platform quality × growth in change volume. If the multiplier is below one, the “smart assistant” accelerates not you but your decay. That is why DORA’s conclusion is addressed not to AI enthusiasts but to platform engineers: first the signal, then the amplifier.
Why an unstable pipeline gets worse with AI
The mechanics of degradation aren’t magic — they’re four observable mechanisms:
- Change volume rises immediately. A developer with an assistant opens not three PRs a week but eight. Each PR is a CI run, a review, a deployment: the load on delivery grows several-fold, its capacity does not.
- Flaky-test harm grows nonlinearly. If 5% of the suite flickers, doubling the number of runs doubles the false reds. The team learns to restart CI without reading it — and one day a genuine red ships to production because it drowned in the noise.
- Savings turn into a traffic jam. The assistant saved half an hour of writing code, but a free runner appears in an hour, and the reviewer tomorrow morning. Locally faster — globally slower: lead time grows while every participant got more productive.
- The feedback loop snaps. The whole point of AI generation is the short “generate — check — adjust” cycle. If checking takes 50 minutes, the assistant idles, and the accumulated “nearly done” changes merge into one big risky deployment — exactly what DORA warned about long before the AI era.
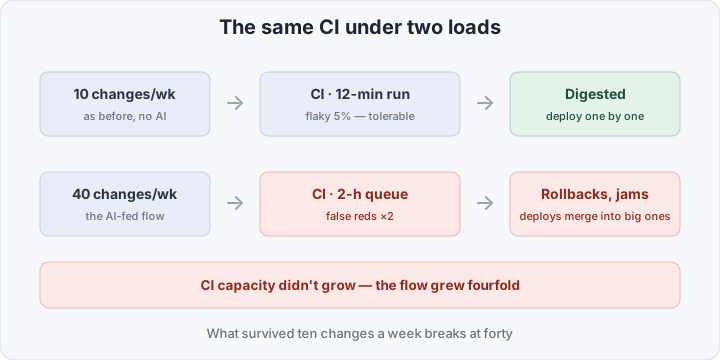
AI doesn’t create a weak platform’s problems — it illuminates them. Everything that survived ten changes a week breaks at forty: the tests you never had enough of, the manual steps nobody can do twice as often, review as the only quality gate.
| Weak platform + AI | Mature platform + AI | |
|---|---|---|
| Change volume | grows | grows — the same one |
| Lead time | grows: CI queue, waiting for review | falls: checks keep up with generation |
| Deployment frequency | falls: deployments merge into big ones | grows: changes ship one by one |
| Change failure rate | grows: noise drowns the signal | flat: a red CI is read, not restarted |
| MTTR | grows: rolling back a big deployment is slow | short: rolling back one small change |
| Review | bottleneck, conflicts, queue | spot-checks against a golden path |
| Outcome | “AI didn’t help us” | “AI paid off” |
One tool — two press quotes. The difference is not the tool.
What to reinforce before subscribing to AI
A “fix what’s about to be multiplied” checklist, in order of decreasing payoff:
- Pull flaky tests out of the shared run. A quarantine job allowed not to block merge, plus a week of fixing — and a green CI becomes a source of truth again. A red CI that gets restarted out of habit is worse than no CI.
- Give the pipeline a duration budget. For a small project, target a full run ≤ 10 minutes: dependency caches, parallel suites, Trivy with a warm vulnerability cache. Fast CI isn’t a convenience — it’s the precondition for a short AI cycle.
- Build a golden path. One service template: repository, CI, deployment, and observability out of the box — as in the IDP for a small team walkthrough. An assistant working from a template is predictable; an assistant without one breeds variations, and only a human catches each of them.
- Shrink change size. Trunk-based development, short-lived branches, a deploy after every merge. A small change is cheap to roll back — that’s what stability is, without a hundred-page process document.
- Automate deployment and rollback. Zero manual steps to production; rollback is one command or a canary with auto-rollback via Flagger. MTTR drops not through the on-call engineer’s heroics but through the absence of manual operations.
You don’t have to do all of it at once. One rule: find the slowest verification link — usually e2e tests or review — and speed that one up first. The same four keys from the next section will tell you where the bottleneck is.
Mini-DORA in one evening: the four keys from GitHub Actions logs
Before agreeing or arguing with the report, capture your own baseline: it computes from the logs of CI you already run — no agents, no dashboards, no purchases. You need gh and Python.
1. Export the deploy workflow history:
gh run list --workflow deploy.yml --limit 300 \
  --json createdAt,conclusion,headSha,displayTitle > runs.json
2. Compute the four metrics:
#!/usr/bin/env python3
# mini-dora.py — four keys from runs.json; run inside a repo clone
import json, subprocess, sys, statistics as st
from datetime import datetime

runs = sorted(json.load(open(sys.argv[1])), key=lambda r: r["createdAt"])
ok   = [r for r in runs if r["conclusion"] == "success"]
iso  = lambda s: datetime.fromisoformat(s.rstrip("Z"))
git  = lambda *a: subprocess.check_output(["git", *a], text=True).strip()
if not ok:
    sys.exit("no successful deployments — check the workflow name")

# deployment frequency — successful deploys per day over the window
days = max((iso(ok[-1]["createdAt"]) - iso(ok[0]["createdAt"])).days, 1)
print(f"deployment frequency: {len(ok)/days:.2f} deploys/day")

# lead time — median from commit to successful deploy, hours
lt = []
for r in ok:
    c = iso(git("show", "-s", "--format=%cI", r["headSha"]))
    d = (iso(r["createdAt"]) - c).total_seconds() / 3600
    if 0 <= d < 24 * 30:          # drop abandoned branches
        lt.append(d)
print(f"lead time (median): {st.median(lt):.1f} h")

# change failure rate — deploys that turned out to be fixes or reverts
fix = sum(1 for r in ok if r["displayTitle"].lower()
          .startswith(("fix", "revert", "hotfix")))
print(f"change failure rate: {fix * 100 // len(ok)}%")

# MTTR — median from a failed deploy to the next successful one, hours
gaps = [(iso(n["createdAt"]) - iso(p["createdAt"])).total_seconds() / 3600
        for p, n in zip(runs, runs[1:]) if p["conclusion"] == "failure"]
if gaps:
    print(f"MTTR (median): {st.median(gaps):.1f} h")
3. Run it inside a repository clone — you need the commit history, because lead time counts from commit time:
python3 mini-dora.py runs.json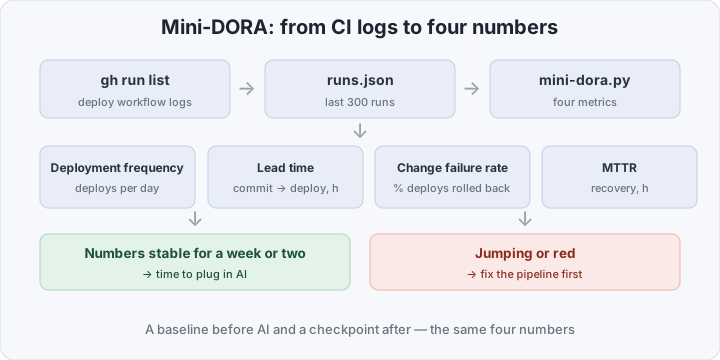
Caveats, so you don’t fool yourself. Lead time here is from commit to the deploy workflow, not to business readiness. Change failure rate by commit-title prefixes is a proxy: it undercounts if you fix production without a fix tag, and overcounts if you write fix: on ordinary tasks. For a first baseline and a trend, that’s enough. Hang the script on a weekly cron and append a row to a CSV: in two months you’ll have not “a number” but a spread, comparable against anything — the effect of AI, or the effect of fixing flaky tests. A Grafana dashboard comes later, when there are more than four metrics: an empty dashboard doesn’t save a weak metric.
How to verify the numbers aren’t lying
- Data window.
runs.jsonshould cover at least three months; if it runs out after a week past--limit 300, there isn’t enough history and the medians will jump from week to week. - Frequency sanity. Do the deploys-per-day match the release cycle you know? If it came out 0.05 against “we ship weekly” — you pulled the wrong workflow: you need
deploy.yml, notci.yml. - Lead-time sanity. The median can’t be shorter than the pipeline duration. If it is — check timezones:
ghreturns UTC with a Z suffix, whilegit %cIgives the author’s local zone. - Spot-check the CFR. Scroll the last 20
fix/revertcommits: how many are actually about a post-deploy failure, and how many about a linter or a README typo.
Bottom line
DORA 2026 said out loud what every team with a sick CI knew without a report: AI amplifies what you already have. A mature platform turns it into an accelerator; a weak one turns it into a chaos multiplier paid for by subscription. So the order is: one evening of mini-DORA from CI logs, a couple of weeks on flaky tests, a duration budget, and a golden path — and only then the AI subscription, whose effect you’ll verify with the same four numbers. The reverse order — amplifier first, system later — burns the budget and ends with “AI didn’t work for us,” when it was the pipeline that didn’t work.