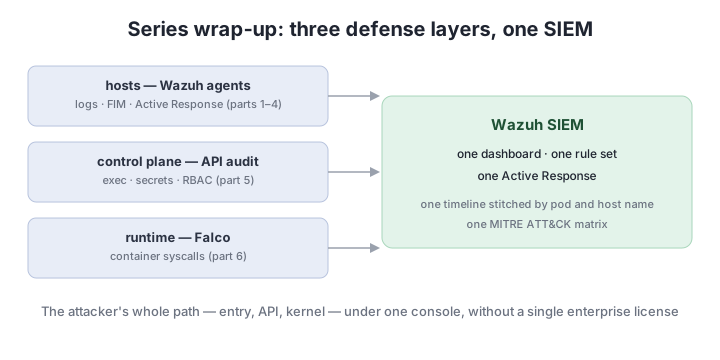

In part 5 the SIEM reached the Kubernetes control plane: API audit showed who ran exec, who read a secret, and who granted themselves RBAC. But that picture had an honest boundary: the API server sees requests, not processes. What a binary does inside a pod after it starts — which files it opens, where it connects, what it launches — is invisible at the API level. The final part of the series closes that gap: we install Falco in the cluster to intercept syscalls in the node kernel, write our own rules, and feed the alerts into the same Wazuh — so hosts, control plane, and runtime converge on one dashboard.
Table of contents
Open Table of contents
What Falco is and where it sits
Falco is a runtime detector from the CNCF: the first runtime security project to reach graduated status (February 2024), with active releases — v0.44.x as of this writing — and production track records at companies like Shopify and GitLab. It deploys as a DaemonSet: one pod per node, which is enough to see every container on that node — yours, someone else’s, and anything launched past your CI.
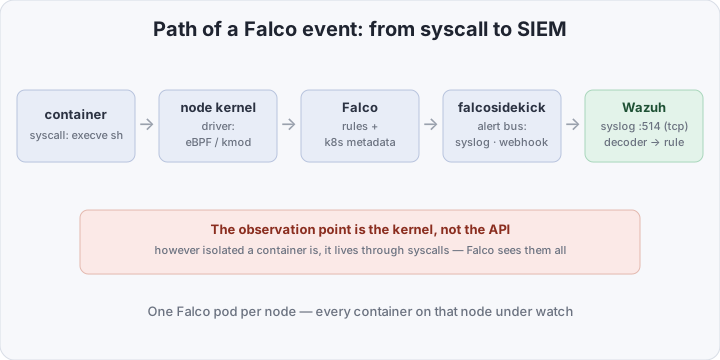
The key to understanding Falco is the observation point. However isolated a container is, it lives through the kernel: execve starts a process, open opens a file, connect opens a connection — all syscalls. Falco’s driver, embedded in the node kernel, receives this stream in full; the engine runs every event through rules, while a parallel enricher queries the API server for context: next to proc.name=sh, the alert carries container.image.repository and k8s.pod.name. Not “some process did something”, but “this exact image, in this pod, in this namespace”.
Driver: eBPF or kernel module
To intercept syscalls, Falco needs a piece of code in the kernel — the driver. There are three options, and the choice comes down to your kernels and who manages them:
| Driver | Requirements | When to choose it |
|---|---|---|
| kernel module | a module matching the kernel version, built and loaded on every node | old kernels without eBPF; environments where BPF is banned by policy |
| eBPF probe | a kernel with BPF enabled; the probe is downloaded as an artifact | a transitional option for 4.x kernels |
| modern_ebpf | kernel ≥ 5.8 with BTF; nothing to download or build | managed clusters and fresh nodes — the sensible default |
The practical advice is simple: if your nodes run kernel 5.8+ — any managed cluster younger than a couple of years — use modern_ebpf: no artifact downloads, no rebuilds after kernel updates. The kernel module remains a valid option for old bare-metal nodes, but it demands discipline: upgrade the kernel, rebuild the module.
Rules: lists, macros, condition
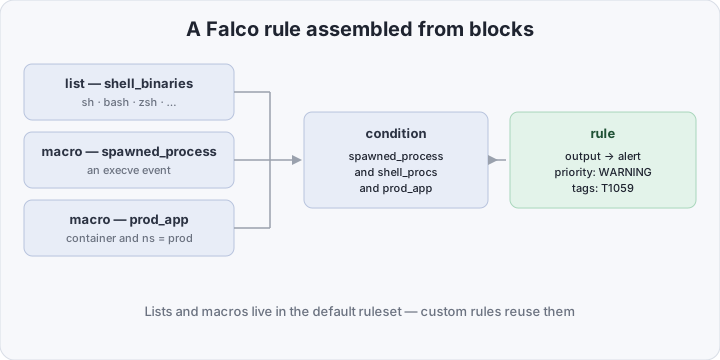
Out of the box Falco ships a ruleset of several hundred rules: shells in containers, writes to sensitive paths, network tool launches, cryptominer behavior, pod-to-API-server contact. The format is YAML, assembled from reusable blocks like a construction kit:
- list — a flat list of values:
shell_binarieswith ash, bash, zsh and the rest, - macro — a named condition fragment:
spawned_processmeans “an execve/execveat event”,containermeans “the event happened inside a container”, - rule — the rule itself: a
conditionbuilt from macros and fields, anoutputwith field values, apriority, andtags.
Custom rules go in a separate file — the default ruleset stays untouched so the chart can keep updating it. Two detects from the brief: a shell in a container where no shell should ever run, and a host-directory mount performed from inside a container:
# app-runtime-rules.yaml
- macro: prod_app
  condition: container and k8s.ns.name in (prod)

- rule: Interactive Shell in Application Container
  desc: Shell spawned inside a prod app container where no shell should ever run
  condition: >
    spawned_process and shell_procs and prod_app
    and not k8s.pod.name startswith debug
  output: >
    shell in app container (user=%user.name proc=%proc.name
    parent=%proc.pname image=%container.image.repository
    pod=%k8s.pod.name ns=%k8s.ns.name)
  priority: WARNING
  tags: [container, shell, mitre_execution, T1059]

- rule: Container Mounting Host Filesystem
  desc: A mount syscall from inside a container — mounting is the runtime's job, not the workload's
  condition: >
    evt.type = mount and container
    and not proc.name in (runc, crun, dockerd, containerd-shim, kubelet)
  output: >
    mount inside container (user=%user.name proc=%proc.name
    args=%evt.args image=%container.image.repository
    pod=%k8s.pod.name ns=%k8s.ns.name)
  priority: CRITICAL
  tags: [container, filesystem, mitre_privilege_escalation, T1611]
Why the rules are written this way:
shell_procsandspawned_processare default-ruleset macros: your detect reuses existing work instead of hand-maintaining the shell list,- the namespace lives in a macro — the “our production containers” condition will be needed again; you change the namespace list in one place, not in every rule,
- the
debugpod exclusion — engineers’ habit of dropping into pods with a debugger should not wake the SIEM; the exclusion is one line of condition, not an allowlist on the manager side, - the mount rule filters out runtime processes: a
mount(2)inside a container is runc and containerd-shim doing their job mounting volumes; if someone else performs the mount, a privileged container is pulling in the host filesystem — and the priority is honestly CRITICAL, - T1059 and T1611 in tags — the same MITRE ATT&CK for Containers techniques we attached to the audit rules in part 5: API and runtime alerts land in one matrix.
falcosidekick: the alert bus
Falco itself is ascetic about outputs: file, stdout, HTTP, gRPC. falcosidekick extends it — a lightweight service that accepts Falco events over HTTP and fans them out to several dozen outputs: Slack and Teams for humans, Loki and Elasticsearch for storage, a webhook for everything else. In the pipeline it plays the bus: the Falco engine is busy filtering and should not know where alerts fly or what to do when a receiver is down. For our task one output is enough — syslog to Wazuh; pick the webhook if alerts are consumed by the Wazuh API or any other HTTP collector.
How Falco complements the part 5 audit
Put both mechanisms side by side — it is clear they do not compete but interlock:
| API audit (part 5) | Falco | |
|---|---|---|
| Observation point | HTTP requests to kube-apiserver | syscalls of every container on the node |
| Answers the question | “who asked the cluster for what” | “what the process actually did” |
| Typical detects | exec, secret reads, RBAC drift | shell in a pod, writes to /etc, a cryptominer |
| Blind spot | processes after the pod starts | RBAC context: who created the pod |
| Where it lives | apiserver flags + Fluent Bit | a DaemonSet in the cluster |
| Cost | audit log volume | some CPU and RAM per node |
The same attack through the combined lens: the audit records “dev@company ran exec into api-7d9f”, Falco records “a sh started in api-7d9f, read /etc/passwd, and opened an outbound connection”. The first says who got in, the second what the intruder did; Wazuh stitches the timeline together by pod name.
What you need to run Falco and send alerts to Wazuh
- a Kubernetes cluster with kernel ≥ 5.8 for modern_ebpf and Helm installed,
- a Wazuh manager with the syslog receiver from part 5 — the same
<remote>on 514/tcp withallowed-ipsscoped to the pod network; nothing new to open, - a prod namespace with any application whose containers should never contain a shell.
The chart configuration is a single values file that turns on the driver, JSON output, our rules, and the sidekick:
# values-falco.yaml
driver:
  kind: modern_ebpf

falco:
  json_output: true
  json_include_output_property: true
  time_format_iso_8601: true
  priority: warning        # cutoff threshold: no notice-level noise

customRules:
  app-runtime-rules.yaml: |-
    # both rules from the previous section — verbatim

falcosidekick:
  enabled: true
  config:
    syslog:
      host: "WAZUH_MANAGER_IP"
      port: "514"
      protocol: "tcp"
Installation:
helm repo add falcosecurity https://falcosecurity.github.io/charts
helm repo update
helm install falco falcosecurity/falco -n falco --create-namespace -f values-falco.yaml
The chart wires falcosidekick.enabled up by itself: Falco starts sending JSON events to the sidekick service, and the sidekick to your syslog. The event arrives at the manager in the shape familiar from part 5 — a JSON line:
{"hostname":"node-1","output":"shell in app container (user=root proc=sh ...)","priority":"Warning","rule":"Interactive Shell in Application Container","time":"2026-10-12T07:12:44.123456789Z","output_fields":{"container.image.repository":"shop/api","k8s.ns.name":"prod","k8s.pod.name":"api-7d9f-xk2lp","proc.name":"sh","user.name":"root"}}Then comes the familiar decoder-and-rules pair, in /var/ossec/etc/decoders/local_decoder.xml:
<decoder name="falco">
  <prematch>^.+"priority":"</prematch>
  <plugin_decoder>JSON_Decoder</plugin_decoder>
</decoder>
The prematch hooks onto a field that neither audit events nor agent logs have; the JSON engine unfolds the event, exposing rule, priority, output, and hostname to the rules. The rules go to /var/ossec/etc/rules/local_rules.xml, with IDs continuing part 5’s numbering:
<group name="falco,runtime,">

  <rule id="100220" level="3">
    <decoded_as>falco</decoded_as>
    <description>falco: $(rule) [$(priority)]</description>
  </rule>

  <rule id="100221" level="12">
    <if_sid>100220</if_sid>
    <field name="rule">^Interactive Shell in Application Container</field>
    <description>falco: shell in application container — $(output)</description>
    <mitre><id>T1059</id></mitre>
  </rule>

  <rule id="100222" level="12">
    <if_sid>100220</if_sid>
    <field name="priority">^(Critical|Alert|Emergency)$</field>
    <description>falco: high-priority runtime event — $(rule)</description>
  </rule>

</group>- the level 3 base rule — every runtime event lands on the dashboard while children attach the specifics; the same
if_sidhierarchy we built for the audit, - 100221 — an exact detect by Falco rule name:
outputdrags the whole line with pod and image into the alert, - 100222 — priority-based escalation: CRITICAL events, like our host-filesystem mount, need no rule of their own — Falco’s priority already carries the semantics.
After the edits, restart the manager: systemctl restart wazuh-manager.
How to verify it works
First make sure the sensors are alive — on every node the Falco pod should report loading the driver:
kubectl -n falco get pods -o wide
kubectl -n falco logs -l app.kubernetes.io/name=falco --tail=5
The live end-to-end check is the same as in part 5, only now we watch the runtime: exec a shell into a production pod:
kubectl -n prod exec -it deploy/api -- shThe Falco pod logs should show an Interactive Shell in Application Container line naming your pod, and the manager an alert:
tail -f /var/ossec/logs/alerts/alerts.json | grep -E '100221|100222'If the event is in the Falco logs but not in Wazuh, the transport is broken: check the falcosidekick pod (kubectl -n falco logs deploy/falco-falcosidekick) and /var/ossec/logs/ossec.log for syslog receiver errors. The decoder and rules, as always, are checked offline via /var/ossec/bin/wazuh-logtest: paste the event’s JSON line and confirm Phase 2 finds the falco decoder and Phase 3 rule 100221.
Bottom line
Falco closes the series’ last gap — what Wazuh could not organically see: processes inside containers. Combined with agents on hosts (parts 1–4), control-plane audit (part 5), and runtime detects, you get a SIEM that covers the attacker’s entire path: host entry, API request, kernel syscall. The price is a DaemonSet on the nodes and a dozen lines of YAML. Not a single enterprise license — one dashboard, one rule set, one Active Response for everything.