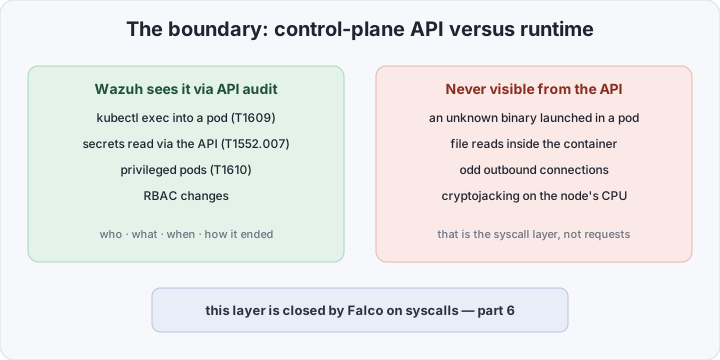

In part 4 Wazuh learned not just to see an attack but to close the attacker’s IP by itself. All that time, though, the SIEM’s view stopped at individual hosts: an agent, its logs, its filesystem. Part 5 changes the scale — we plug in Kubernetes. A cluster has a property both attackers and defenders love: every action in the cluster is a request to the API server. kubectl exec, reading a secret, creating a privileged pod, changing RBAC — all HTTP requests that the API server can record to an audit log. Can — but by default it either does not record them at all, or writes them to a file on the API server itself, where they sit dead weight and where the first person to read them is whoever compromised the cluster.
Table of contents
Open Table of contents
What the API server logs
Kubernetes audit logging is built into kube-apiserver: the --audit-policy-file flag enables a policy that decides which requests get recorded and at what detail level. Each event is one JSON line in the audit.k8s.io/v1 format:
{"kind":"Event","apiVersion":"audit.k8s.io/v1","level":"Request",
 "auditID":"8f6b...","stage":"ResponseComplete","verb":"create",
 "user":{"username":"dev@company","groups":["system:authenticated"]},
 "objectRef":{"resource":"pods","subresource":"exec","namespace":"prod","name":"api-7d9f"},
 "responseStatus":{"code":101}}
This fragment already shows why audit logs are a goldmine for detections: a single event carries who (user.username), what (verb + objectRef), where (namespace, object name), and how it ended (responseStatus.code — 101 on exec is the protocol switch, meaning the session opened). The full line also carries sourceIPs — the address chain from client through any proxies — and userAgent, which tells you whether a human came in through kubectl or something is knocking via a script. These exact techniques — exec into a pod, reading secrets, creating privileged pods — are spelled out in the MITRE ATT&CK for Containers matrix, and they are what we will detect.
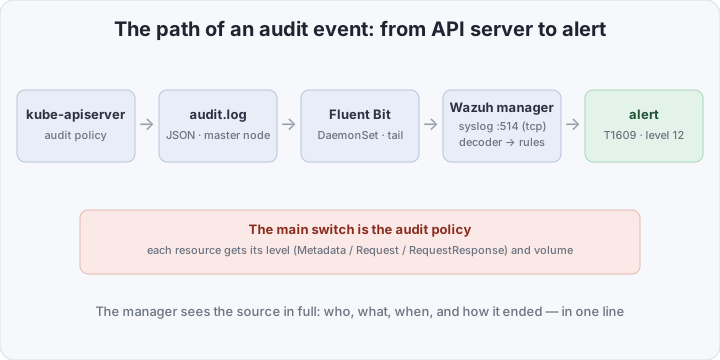
The problem is not that the data is missing — it is that it dies on the API server’s disk: one file per master node, no central storage, no rules, no alerts. The goal of this part is to build the pipeline: API server → Fluent Bit → Wazuh → alert.
Audit levels: Metadata, Request, RequestResponse
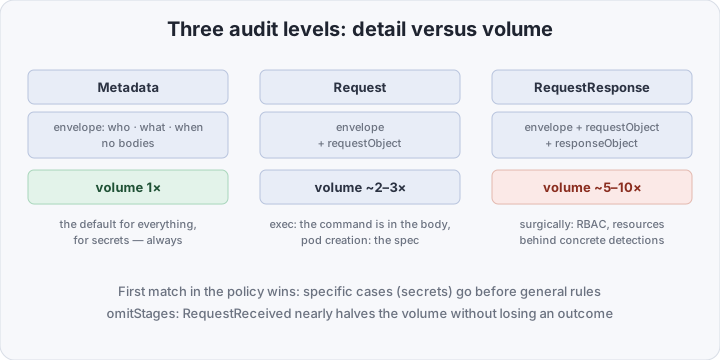
The key decision when writing an audit policy is the detail level per resource type. There are three, differing in how much of the request and response bodies land in the log:
- Metadata — the envelope only: who, what, when, from where. No bodies. One line per event, predictable volume,
- Request — the envelope plus
requestObject: the request body. Forpods/execthis holds the command being run in the pod; for pod creation, the pod spec, - RequestResponse — plus
responseObject: what the API returned. The most detailed and the most expensive: on a busy cluster the log volume easily grows several-fold.
The choice in one table — it is also the answer to “which level for what”:
| Level | Request/response bodies | Volume vs Metadata | When to choose |
|---|---|---|---|
| Metadata | none | 1× | the default for everything; secrets and configmaps — always |
| Request | requestObject | ~2–3× | exec (you need the command), pod creation (you need the spec) |
| RequestResponse | + responseObject | ~5–10×, resource-dependent | surgically: RBAC, specific resources behind concrete detections |
Two decisions that determine the volume and the safety of the log itself:
- omitStages with “RequestReceived” — by default the API server records each event twice: on entry and after processing. Ninety percent of the second copy is noise: dropping the RequestReceived stage nearly halves the volume without losing a single outcome,
- secrets — Metadata only, never RequestResponse. A classic mistake made with the best intentions: enable RequestResponse for everything “to see more” — and drag every secret body in the cluster into the logs, and with them into the SIEM, the backups, and everywhere logs flow next. An attacker only needs read access to the logs — far quieter than read access to the secrets themselves.
The policy is an ordered list of rules, first match wins, so specific cases come before general ones:
apiVersion: audit.k8s.io/v1
kind: Policy
omitStages:
  - "RequestReceived"
rules:
  # 1. secrets — Metadata only: secret bodies must not
  #    leak into logs and the SIEM
  - level: Metadata
    resources:
      - group: ""
        resources: ["secrets", "configmaps"]

  # 2. exec/attach/portforward — Request: the command is in
  #    requestObject; the response is a binary stream that
  #    is not there anyway
  - level: Request
    resources:
      - group: ""
        resources: ["pods/exec", "pods/attach", "pods/portforward"]

  # 3. pods — RequestResponse: the spec feeds the privileged-pod
  #    detection, the response confirms the pod was created
  - level: RequestResponse
    resources:
      - group: ""
        resources: ["pods"]

  # 4. RBAC — always the maximum: who granted themselves
  #    permissions is the most interesting with request bodies
  - level: RequestResponse
    resources:
      - group: "rbac.authorization.k8s.io"
        resources: ["roles", "rolebindings", "clusterroles", "clusterrolebindings"]

  # 5. everything else — Metadata
  - level: Metadata
In a self-hosted cluster (kubeadm) the policy is enabled with two flags in /etc/kubernetes/manifests/kube-apiserver.yaml, with the policy file and log directory mounted into the pod via hostPath:
- --audit-policy-file=/etc/kubernetes/audit-policy.yaml
- --audit-log-path=/var/log/kubernetes/audit.log
- --audit-log-maxage=7
In managed clusters the audit log lands in the cloud log store (CloudWatch on EKS, Cloud Logging on GKE) — the pipeline is the same, only Fluent Bit’s input changes.
The decoder: teaching Wazuh to read audit events
Next is the machinery we built in part 3: a prematch picks out our lines, and the JSON engine unfolds nested fields into dot paths. In /var/ossec/etc/decoders/local_decoder.xml:
<decoder name="k8s-audit">
  <prematch>^.+"kind":"Event".+"apiVersion":"audit.k8s.io</prematch>
  <plugin_decoder>JSON_Decoder</plugin_decoder>
</decoder>
After the decoder, an event’s fields are available to rules as dynamic fields: verb, user.username, objectRef.resource, objectRef.namespace, requestObject.*. Nested JSON arrays unfold with numeric indices — requestObject.spec.containers.0.securityContext.privileged — which we will use for privileged pods.
Rules: exec, secrets, privileged pods
The three detections from the brief, in /var/ossec/etc/rules/local_rules.xml. A base rule recognizes every audit event, children add conditions — the same if_sid hierarchy we built for SSH and billing:
<group name="kubernetes,audit,">

  <rule id="100210" level="3">
    <decoded_as>k8s-audit</decoded_as>
    <description>kubernetes: audit event $(objectRef.resource) $(verb)</description>
  </rule>

  <rule id="100211" level="12">
    <if_sid>100210</if_sid>
    <field name="verb">^create$</field>
    <field name="objectRef.resource">^pods/exec$</field>
    <field name="user.username">!^system:serviceaccount:kube-system:</field>
    <description>kubernetes: exec into pod by $(user.username) — outside allowlist</description>
    <mitre><id>T1609</id></mitre>
  </rule>

  <rule id="100212" level="9">
    <if_sid>100210</if_sid>
    <field name="verb">^get|list|watch$</field>
    <field name="objectRef.resource">^secrets$</field>
    <field name="user.username">!^system:serviceaccount:</field>
    <description>kubernetes: secrets read via API by human user $(user.username)</description>
    <mitre><id>T1552.007</id></mitre>
  </rule>

  <rule id="100213" level="12">
    <if_sid>100210</if_sid>
    <field name="verb">^create$</field>
    <field name="objectRef.resource">^pods$</field>
    <field name="requestObject.spec.containers.0.securityContext.privileged">^true$</field>
    <description>kubernetes: privileged pod created by $(user.username)</description>
    <mitre><id>T1610</id></mitre>
  </rule>

</group>
What matters here:
- the level-3 base rule — keeps audit events flowing into alerts so you can build dashboards on them; if the volume gets heavy, drop it to 0 — the children keep firing,
- negation with
!in a field — the entire kube-system service-account allowlist fits in one condition: exec fromkube-systemis operators and CSI doing their job; from anyone else it is an event to review, - secrets reads are allowed only for service accounts — humans have no business pulling secrets directly in the cluster; controllers do it constantly, so we cut off the whole
system:serviceaccount:prefix, - the privileged pod is caught by a field from the request body — this is exactly what the RequestResponse level on pods is for: the flag lives in
requestObject, and the JSON engine reaches it through the container’s numeric index, - the
mitreblocks — Wazuh knows the ATT&CK matrix and shows the technique right on the alert card; for reporting and triage that is cheaper than any explanation of why your SIEM exists.
Delivery: Fluent Bit to the manager
The last piece is getting the log to Wazuh. The canonical path from the docs is a Fluent Bit DaemonSet: a pod on every node reads the audit log from hostPath and ships it to the manager over syslog over TCP. The ConfigMap:
[SERVICE]
    Flush             5
    Daemon            Off
    Log_Level         warning

[INPUT]
    Name              tail
    Path              /var/log/kubernetes/audit.log
    Refresh_Interval  10
    Skip_Long_Lines   On

[OUTPUT]
    Name              syslog
    Host              WAZUH_MANAGER_IP
    Port              514
    Mode              tcp
    Syslog_Hostname   k8s-audit
    Syslog_Appname    kube-apiserver
    Syslog_Tag        audit
The DaemonSet mounts /var/log/kubernetes from the master nodes (the full manifest is in the Wazuh docs — usual tolerations for control-plane). On the manager, open a syslog receiver in ossec.conf for the cluster’s pod network only:
<remote>
  <connection>syslog</connection>
  <port>514</port>
  <protocol>tcp</protocol>
  <allowed-ips>10.42.0.0/16</allowed-ips>
</remote>
allowed-ips is not cosmetics here: an open syslog port on 514 is an invitation for the whole internet to feed garbage into your SIEM, so the receiver only looks into the pod network.
How to verify it works
Unlike the Active Response of part 4, decoders and rules can be tested without a live cluster — /var/ossec/bin/wazuh-logtest runs a line through all phases. Take a real line from /var/log/kubernetes/audit.log on a master, paste it into logtest, and confirm Phase 2 finds k8s-audit and Phase 3 fires rule 100211.
The live end-to-end check is an exec from a human account into any pod in a production namespace:
kubectl -n prod exec -it deploy/api -- shOn the manager:
tail -f /var/ossec/logs/alerts/alerts.json | grep -E '100211|100212|100213'An alert with T1609, your user.username, and the pod name should arrive within seconds (Flush 5). If logtest fires but live alerts do not — the transport is broken: check the Fluent Bit logs (kubectl logs -n logging -l app=fluent-bit) and /var/ossec/logs/ossec.log for syslog receiver errors.
Bottom line
The Kubernetes audit log is a rare case where the best source of cluster-compromise signals is already being written for free — it just needs to be carried to the SIEM: a hundred-line policy, a Fluent Bit ConfigMap, a three-line decoder, and three rules — and Wazuh sees everything happening on the control-plane API: who logged in, who ran exec, who granted themselves RBAC. But this picture has a boundary: the API server sees requests, not processes. What a binary launched inside a container, which files it opened, where it connected — none of that exists at the API level, and audit will never show it. That gap is closed by runtime detection on syscalls — Falco, the hero of the final part of the series.