

Prometheus is excellent as long as your metrics fit the local disk: two weeks of retention, one StatefulSet, zero external dependencies. The pain starts with “what happened a month ago?” — and Thanos bolts onto Prometheus: sidecar, store gateway, compactor, query. VictoriaMetrics covers the same scenario with a single process, and in July 2026 it shipped the v1.148.0 LTS line with a year of fixes ahead — a good moment to lay out honestly at what metric size this is savings, and where it is self-deception.
Table of contents
Open Table of contents
- Where “just Prometheus” ends up
- What VictoriaMetrics changes
- The applicability threshold: single vs cluster
- Prometheus+Thanos vs VM single
- Two migration paths
- What it takes to assemble the stack in one namespace
- Cardinality: the main budget killer
- Numbers: RAM and disk
- How to verify it works
- Bottom line
Where “just Prometheus” ends up
The local TSDB stores blocks on a PV: a year of retention means a terabyte disk and cold-cache restarts. HA means two Prometheus instances and dedup at read time.
The standard answer is Thanos. Honest architecture for terabytes — but count the components: a sidecar next to every Prometheus, a store gateway (index over old blocks), a compactor (compaction and downsampling), and query (stitching fresh and old). Four to five deployments with versions and upgrades of their own, plus a bucket in S3.
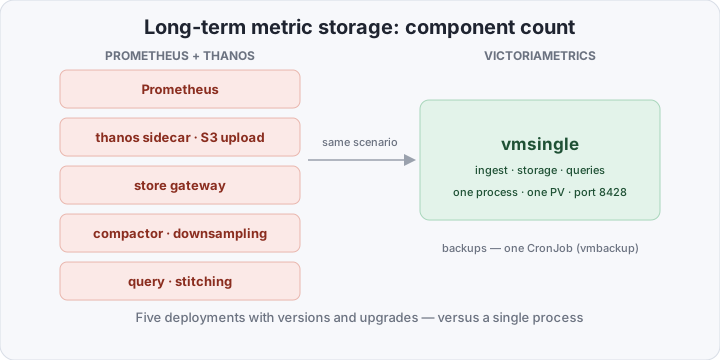
On a small cluster each is nearly empty: a store gateway over gigabytes, a query nobody loads. You operate a topology built for terabytes to serve tens of gigabytes.
What VictoriaMetrics changes
- one binary — ingest, storage and queries in a single process: one PV, one port
:8428; - compatibility — remote_write, the Prometheus HTTP API and Grafana dashboards as-is; MetricsQL is a practical superset of PromQL;
- compression — delta encoding over values and label sets: the same data takes several times less disk;
- retention is a flag, not an architecture —
-retentionPeriodchanges with a restart, no compaction or S3 re-plumbing; - one version for everything — vmagent, vmalert and vmbackup release in lockstep with vmsingle: an upgrade is a tag change.
What you actually need from the ecosystem at small scale:
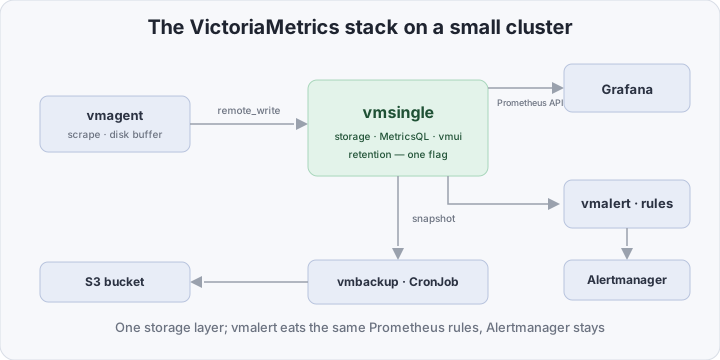
- vmagent — scraping and delivery: the same service discovery as Prometheus, relabeling, a disk buffer. Needed for a full replacement;
- vmalert — rules and alerts: eats the same Prometheus rules; Alertmanager stays, VM does not replace it;
- vmbackup — scheduled snapshots to S3 plus vmrestore to verify recovery; automatic incremental backups are vmbackupmanager (enterprise);
- vmgateway — auth and rate limiting in front of VM: an enterprise component, not needed at small scale.
The applicability threshold: single vs cluster
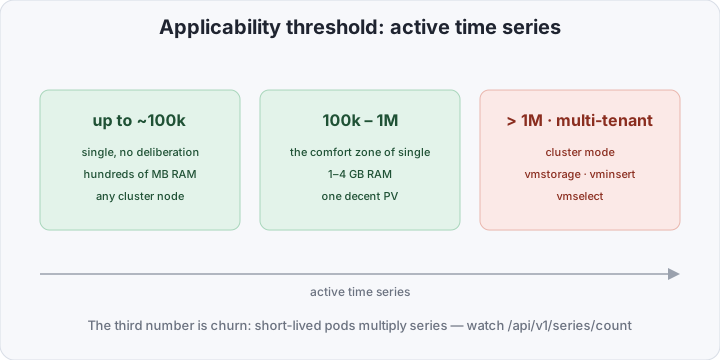
Operate by three numbers: active time series (unique label sets), ingest rate (samples/sec), and churn (series born and dying per hour).
- up to ~100k — single, no deliberation: hundreds of MB of RAM, any node;
- ~100k–1M — the comfort zone of single: 1–4 GB RAM, one PV; watch RAM and io, the architecture doesn’t change;
- >1M, multi-tenancy or horizontal scaling — cluster mode: vmstorage (data), vminsert (write), vmselect (read).
A caveat about HA: single is one process. vmbackup backups are mandatory, and live ingest failover is an argument for cluster mode — not for “a second vmsingle”. vmagent’s buffer softens the picture: while the storage is unavailable, metrics pile up on the agent’s disk.
Prometheus+Thanos vs VM single
| Prometheus + Thanos | VM single | |
|---|---|---|
| Storage components | 4–5 deployments | 1 (+ a backup CronJob) |
| Storage | S3 + local TSDB | PV + S3 for backups |
| Stack RAM | ~5–6 GB | ~1–1.5 GB |
| Disk for the same data | 1× | usually 2–4× less |
| Deep queries | query + store, with lag | one endpoint |
| Changing retention | compaction, downsampling | -retentionPeriod + restart |
| Upgrades | 4 components in sync | one tag for the stack |
| Ingest HA | two Prometheus + dedup | cluster mode |
| Rules and alerts | Prometheus rules | vmalert + Alertmanager, same rules |
| Query language | PromQL | MetricsQL (a superset) |
Two migration paths
Remote-write from the existing Prometheus. Minimal risk: add a remote_write to http://vmsingle:8428/api/v1/write, shrink local retention, move rules to vmalert as you go. The rollback is deleting one line. History older than retention is migrated by vmctl prometheus (TSDB snapshot import).
Full replacement. vmagent takes over scraping (the same kubernetes_sd roles and relabel configs), Prometheus goes away. A whole stack and most of the monitoring RAM disappear; the price is moving rules. That’s the scenario deployed below.
What it takes to assemble the stack in one namespace
The whole stack lives in the monitoring namespace, on the v1.148.0 LTS (fixes until summer 2027): vmagent writes to vmsingle, vmalert runs rules into Alertmanager, vmbackup snapshots to S3 every 6 hours, Grafana reads through one datasource.
1. Storage: vmsingle. A Deployment with a PVC and a Service:
apiVersion: apps/v1
kind: Deployment
metadata:
  name: vmsingle
  namespace: monitoring
spec:
  replicas: 1
  selector: { matchLabels: { app: vmsingle } }
  template:
    metadata: { labels: { app: vmsingle } }
    spec:
      containers:
        - name: vmsingle
          image: victoriametrics/victoria-metrics:v1.148.0
          args:
            - -storageDataPath=/storage
            - -retentionPeriod=12m      # months
            - -search.maxUniqueTimeseries=500000   # above your series count
          ports: [{ containerPort: 8428 }]
          volumeMounts: [{ name: data, mountPath: /storage }]
      volumes:
        - name: data
          persistentVolumeClaim: { claimName: vmsingle-data }
---
apiVersion: v1
kind: Service
metadata:
  name: vmsingle
  namespace: monitoring
spec:
  selector: { app: vmsingle }
  ports: [{ port: 8428 }]
2. Scraper: vmagent. The scrape config is plain Prometheus:
apiVersion: v1
kind: ConfigMap
metadata:
  name: vmagent-config
  namespace: monitoring
data:
  scrape.yml: |
    global:
      scrape_interval: 30s
    scrape_configs:
      - job_name: kubernetes-pods
        kubernetes_sd_configs:
          - role: pod
        relabel_configs:
          - source_labels: [__meta_kubernetes_pod_annotation_prometheus_io_scrape]
            action: keep
            regex: "true"
          - source_labels: [__address__, __meta_kubernetes_pod_annotation_prometheus_io_port]
            action: replace
            regex: ([^:]+)(?::\d+)?;(\d+)
            replacement: $1:$2
            target_label: __address__
      # nodes — role: node via the apiserver proxy, config identical to Prometheus
The agent’s args — cardinality-explosion protection lives here too:
# Deployment vmagent, excerpt
image: victoriametrics/vmagent:v1.148.0
args:
  - -promscrape.config=/config/scrape.yml
  - -remoteWrite.url=http://vmsingle:8428/api/v1/write
  - -remoteWrite.tmpDataPath=/buffer      # buffer while storage is down
  - -remoteWrite.maxHourlySeries=300000   # cap on new series per hour
  - -remoteWrite.maxDailySeries=1000000   # and per day: a bad-release fuse
3. Rules: vmalert. Rules from kube-prometheus-stack move over unchanged; an example:
apiVersion: v1
kind: ConfigMap
metadata:
  name: vmalert-rules
  namespace: monitoring
data:
  rules.yaml: |
    groups:
      - name: k8s
        rules:
          - alert: PodRestartLoop
            expr: increase(kube_pod_container_status_restarts_total[15m]) > 3
            for: 5m
            labels: { severity: warning }
# Deployment vmalert, excerpt
image: victoriametrics/vmalert:v1.148.0
args:
- -datasource.url=http://vmsingle:8428
- -remoteWrite.url=http://vmsingle:8428 # recording rules — back into VM
- -remoteRead.url=http://vmsingle:8428 # alert state after restart
- -notifier.url=http://alertmanager:9093 # Alertmanager sits alongside
- -rule=/config/*.yaml4. Backups: vmbackup on a CronJob. The snapshot is created on the vmsingle side:
apiVersion: batch/v1
kind: CronJob
metadata:
  name: vmbackup
  namespace: monitoring
spec:
  schedule: "0 */6 * * *"
  jobTemplate:
    spec:
      template:
        spec:
          restartPolicy: OnFailure
          containers:
            - name: vmbackup
              image: victoriametrics/vmbackup:v1.148.0
              args:
                - -snapshot.createURL=http://vmsingle:8428/snapshot/create
                - -dst=s3://metrics-backup/vmsingle
                - -storageDataPath=/storage
                - -s3.endpoint=s3.eu-central-1.amazonaws.com
              volumeMounts: [{ name: data, mountPath: /storage }]
          volumes:
            - name: data
              persistentVolumeClaim: { claimName: vmsingle-data }
S3 keys come from environment variables out of a Secret (AWS_ACCESS_KEY_ID/AWS_SECRET_ACCESS_KEY).
5. Grafana. A prometheus datasource — the API is compatible:
apiVersion: v1
kind: ConfigMap
metadata:
  name: grafana-datasources
  namespace: monitoring
data:
  vm.yaml: |
    apiVersion: 1
    datasources:
      - name: VictoriaMetrics
        type: prometheus
        url: http://vmsingle:8428
        isDefault: true
Cardinality: the main budget killer
Cardinality is the number of unique label sets. Every new pod and endpoint multiplies it, and one wrong label (user_id, request_id) turns 100k series into 10M. Find the offenders with two queries:
topk(10, count({__name__=~".+"}) by (__name__))
topk(10, count by (pod) ({__name__=~".+"}))
The cure, in escalating order:
- drop at the door —
metric_relabel_configsin vmagent:go_*runtime chatter and kubelet duplicates should not reach the storage at all; - labeldrop — cut churny labels (
pod,container_id) where they aren’t needed for diagnosis; - streamAggr in vmagent — summarize chatty metrics before writing, not after;
- ingest caps —
maxHourlySeries/maxDailySeries: past the cap, new series are dropped with an error in the logs. That’s protection against a bad release, not a substitute for hygiene — it will cut legitimate growth too, so keep the series count (GET /api/v1/series/count) on a dashboard.
Numbers: RAM and disk
A typical small prod setup: three nodes, ~50 pods, kube-prometheus-stack with a couple of exporters — around 150k active series at a 30s interval. The order of magnitude:
- Prometheus: 2–3 GB RAM and 25–35 GB of disk for 90 days;
- VM single on the same data: 0.5–1 GB RAM and 8–12 GB of disk — label-set compression typically gives 2–4×, up to 7× on repeating values;
- Thanos on top — another 1.5–2 GB RAM for sidecar/store/compactor/query plus compaction, downsampling and lifecycle in S3;
- churn hurts both, but VM takes it more gently: a new series costs less in VM’s ingest buffer than in Prometheus’s head block.
So: three times less RAM for the stack and two to four times less disk. The savings aren’t in licenses (everything you need is open source) but in operations: one object to upgrade instead of five.
How to verify it works
kubectl -n monitoring get pods
curl -s http://vmsingle.monitoring:8428/health
curl -s http://vmsingle.monitoring:8428/api/v1/series/count- vmui —
kubectl -n monitoring port-forward svc/vmsingle 8428:8428, openhttp://localhost:8428/vmui: queryupand the cardinalitytopk; - Grafana — kube-prometheus-stack dashboards work unchanged; only the datasource changes;
- backups — after the first CronJob run, check the bucket and the restore:
vmrestoreinto a scratch PVC and a vmsingle started on it. An unverified backup is not a backup.
Bottom line
Up to ~a million active time series, VictoriaMetrics single-binary is the cheapest-to-operate way to keep metrics for long: one process, one PV, one backup CronJob, several times less RAM and disk than Prometheus+Thanos on the same data. Thanos is justified when there are many clusters, more than one tenant, and terabytes of metrics — there its topology is a necessity, not redundancy. The dividing line is measurable: active time series. And so logs and traces live next to your metrics — see the minimal OpenTelemetry Collector covered separately.